Revolutionising footpath network improvement planning
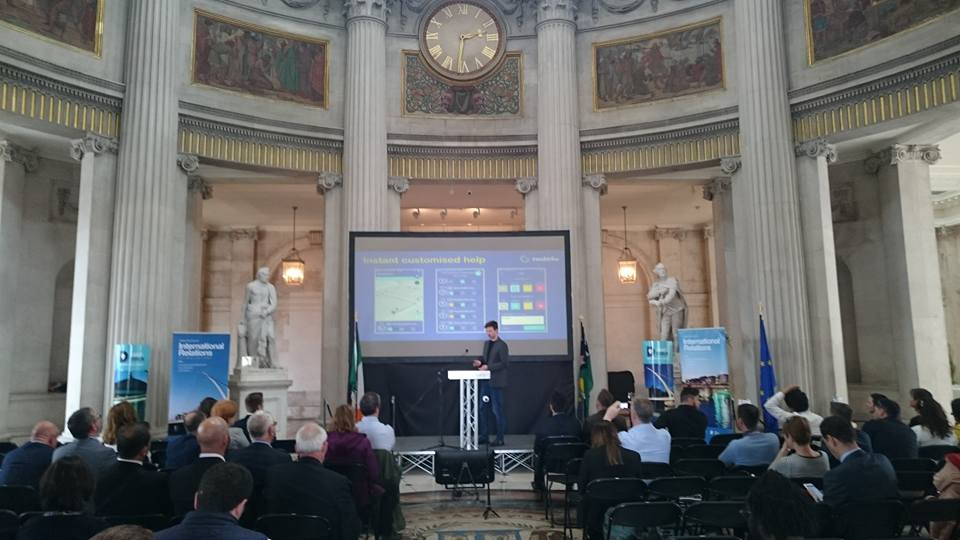
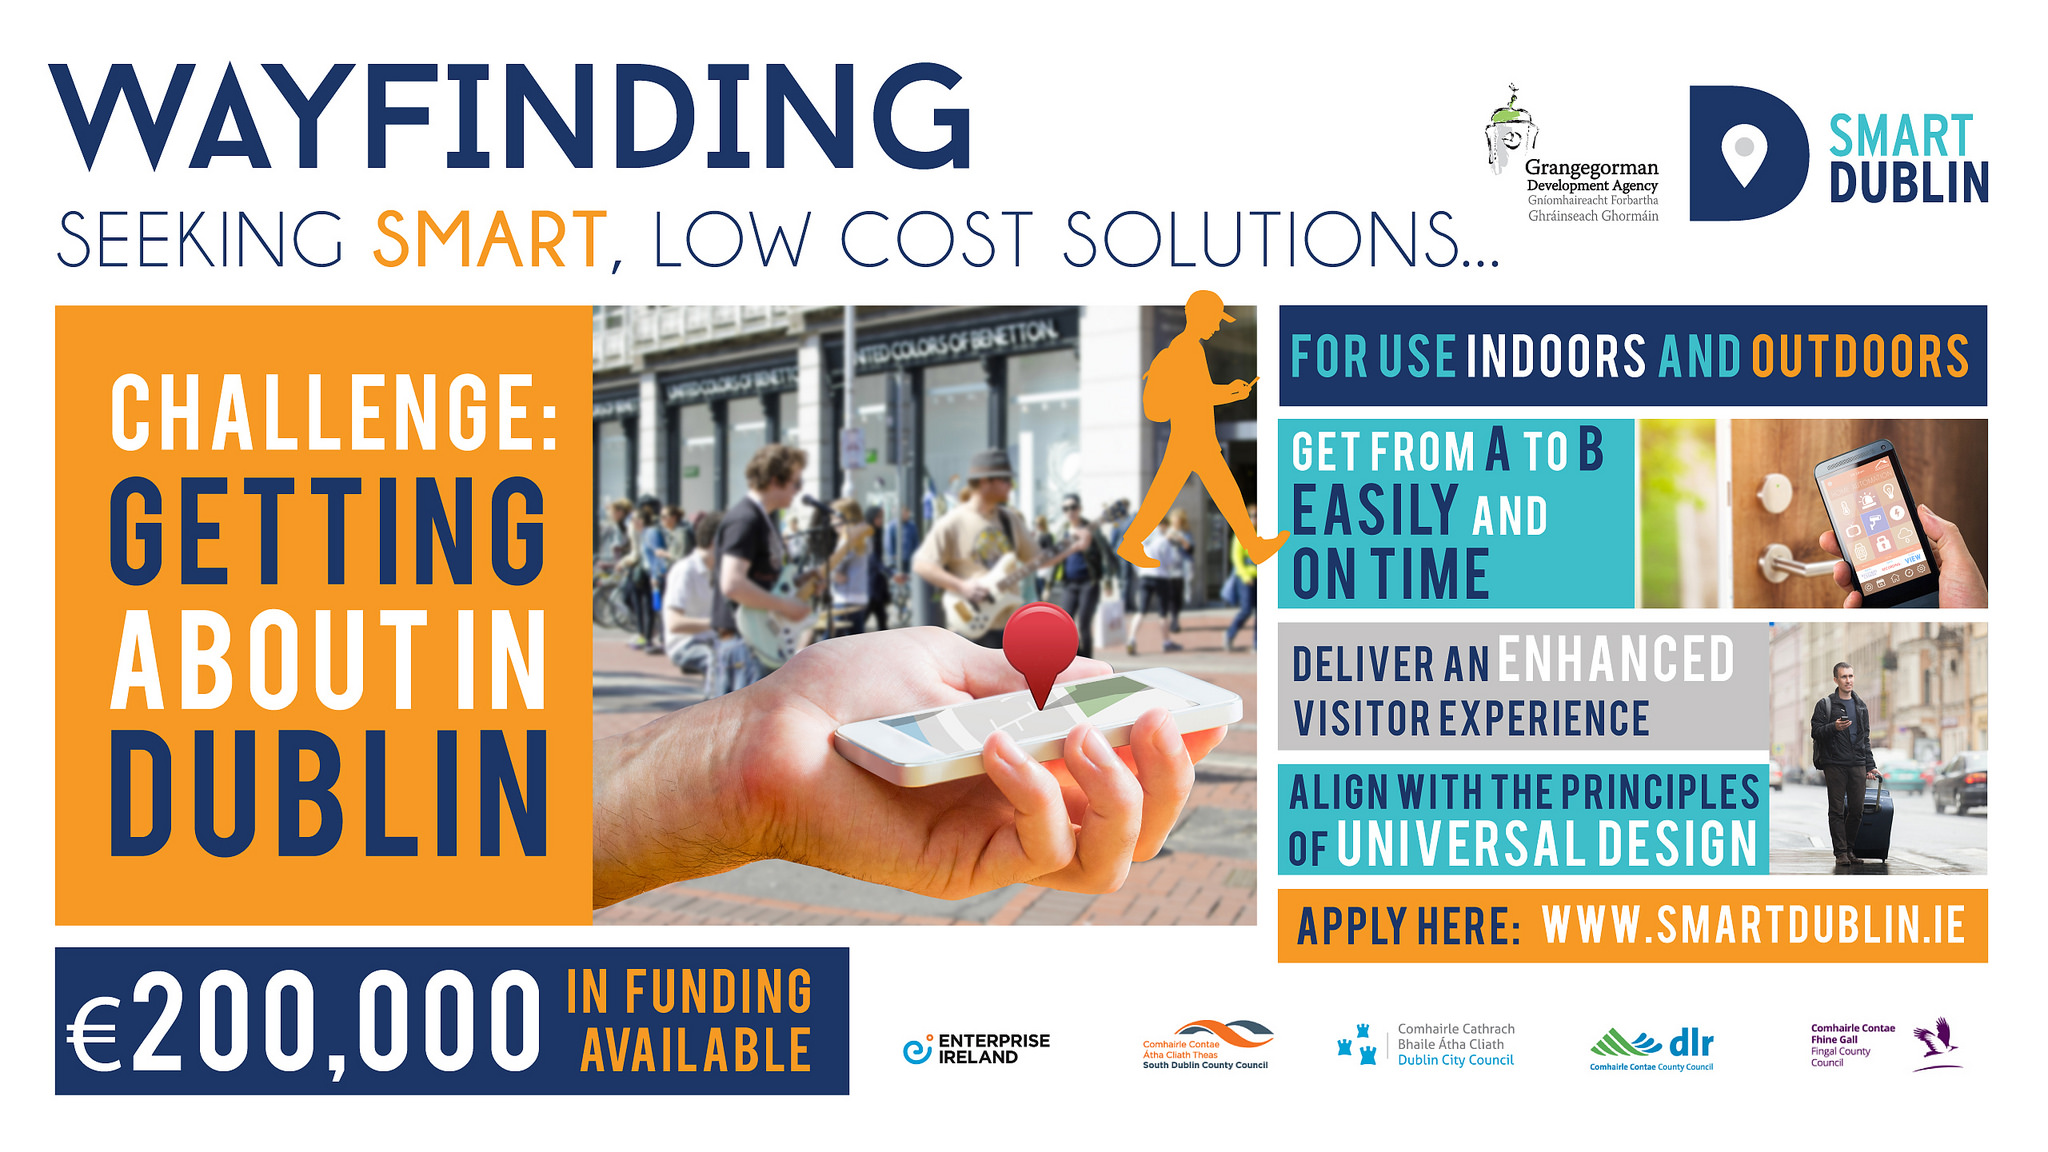
As part of our ‘Smart Dublin Wayfinding Challenge’ execution, during the past 6 months, a new footpath related city decision support tool was developed and introduced for opinion to city decision makers of towns such as Dublin, Swords, Galway, Limerick, Dusseldorf and Budapest.
Although the system currently works with an initial functionality, city officials got really interested when they learned what sort of information may be derived from the footpath data set collected by our staff and by the general crowd. Officers of different city departments like planning, road maintenance, public realm, transport, and accessibility agree that a useful tool is being developed which lets them better understand and visualise their existing footpath network and helps to identify the most advantageous development options.
By assigning ‘walkability’, ‘rollability’ (wheelchair accessibility) and ‘inclusion’ indexes to small neighbourhoods of the city the accessibility of the neighbourhoods is quantified. This quantification makes it possible to compare different parts of the city or make a comparison between cities as well as to accurately measure and report the progress of improvements.
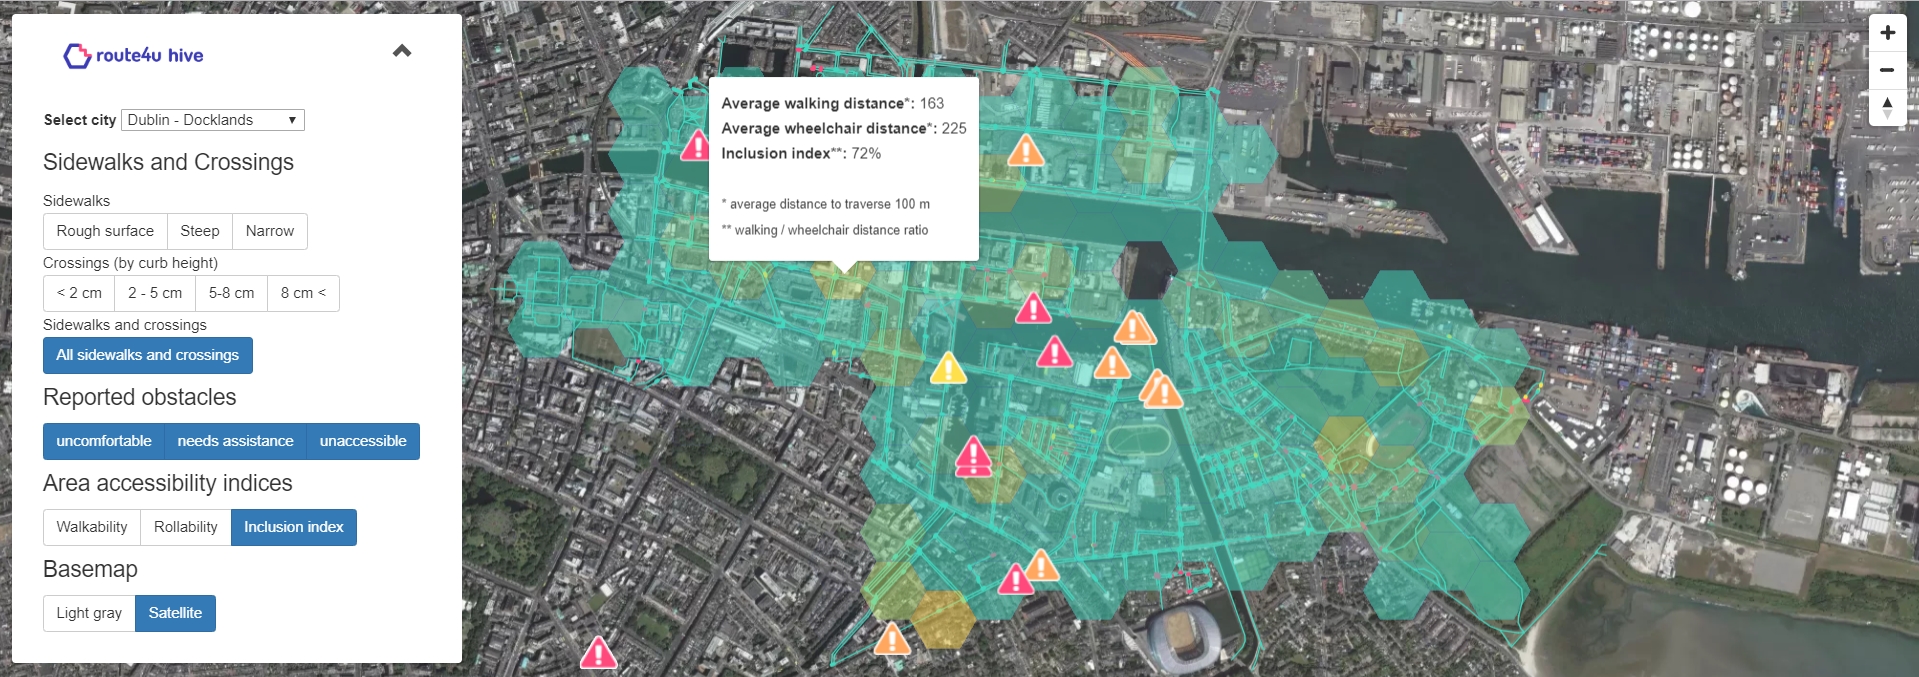
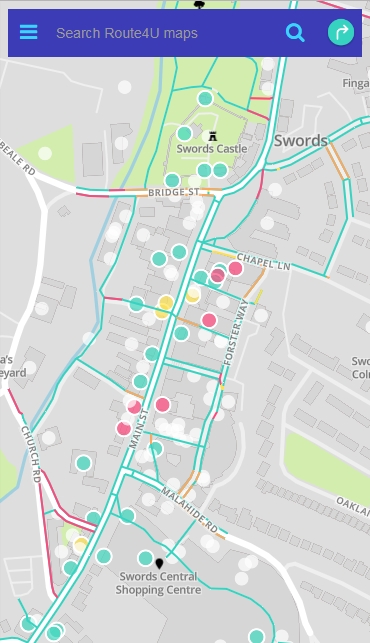
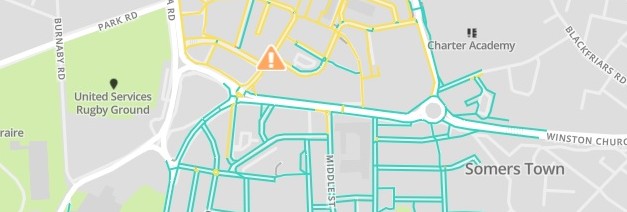
Dublin Docklands: a highly accessible area, although frequent constructions might cause temporary obstructions
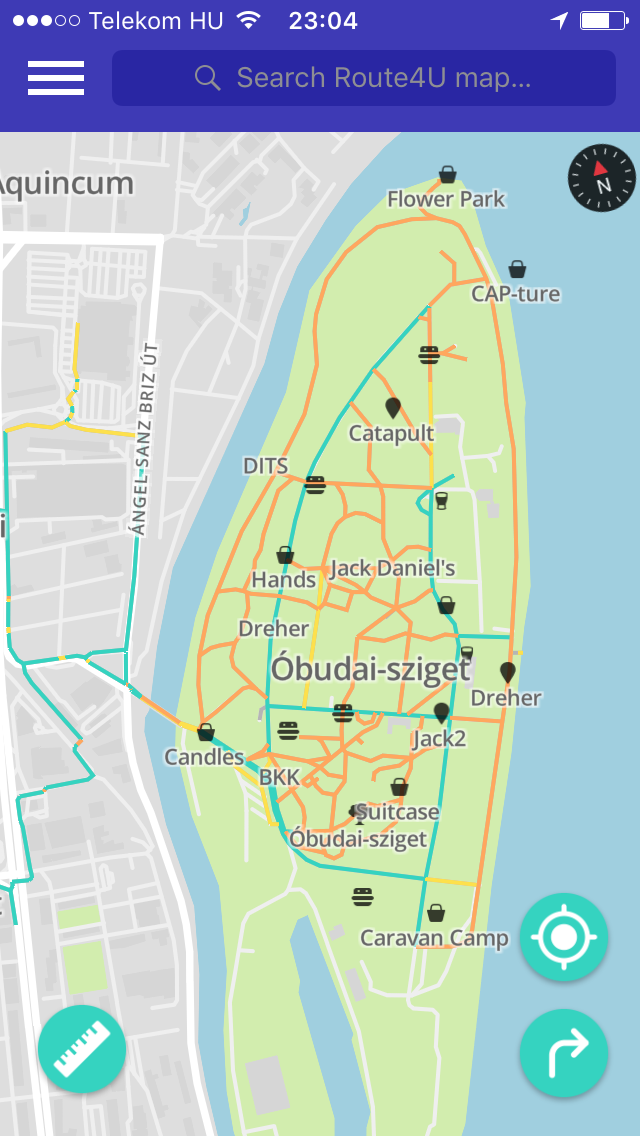
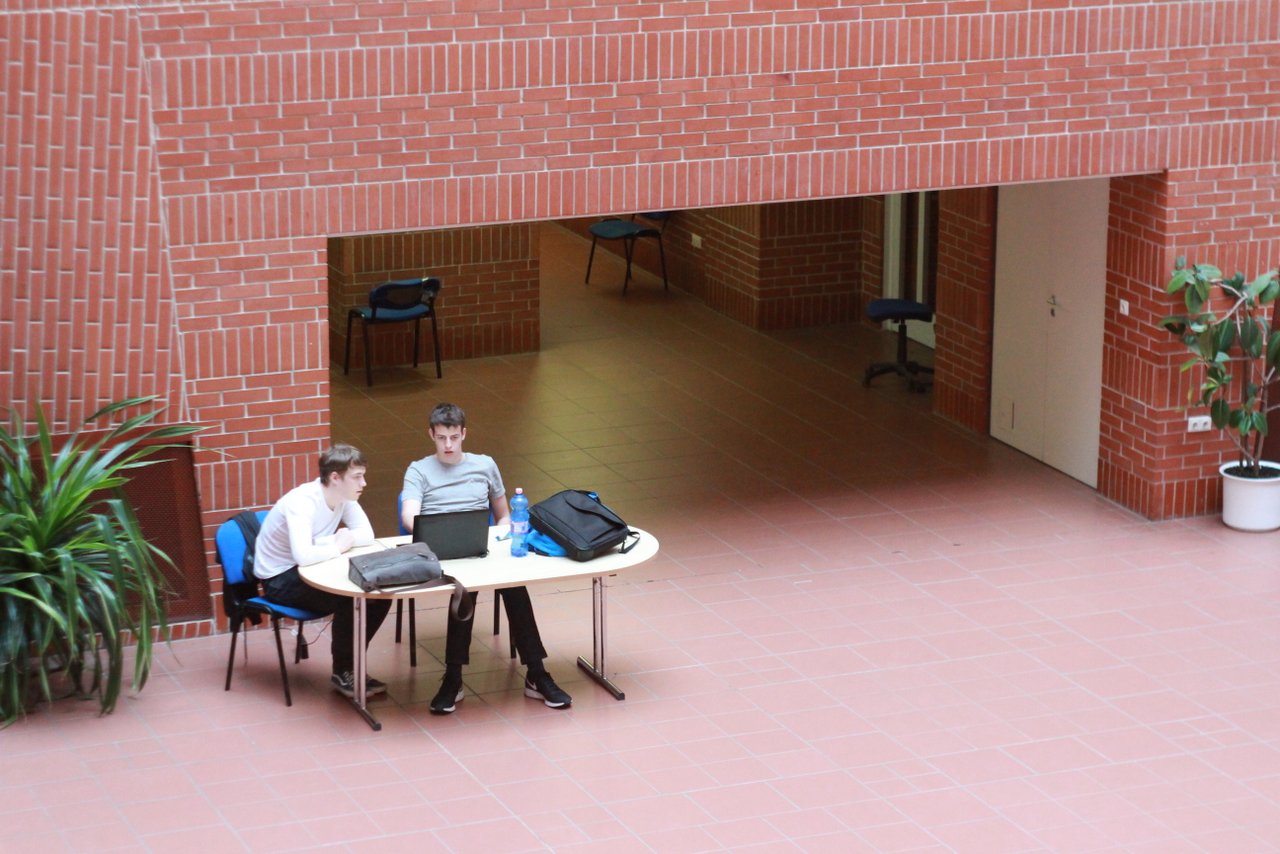
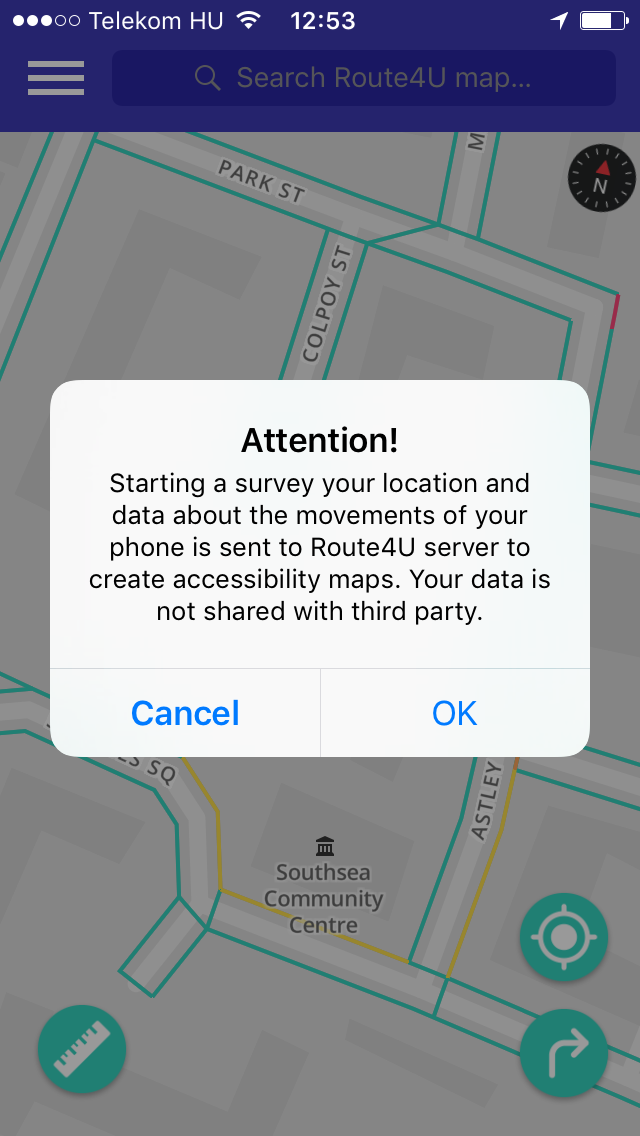
Walkability data from the crowd
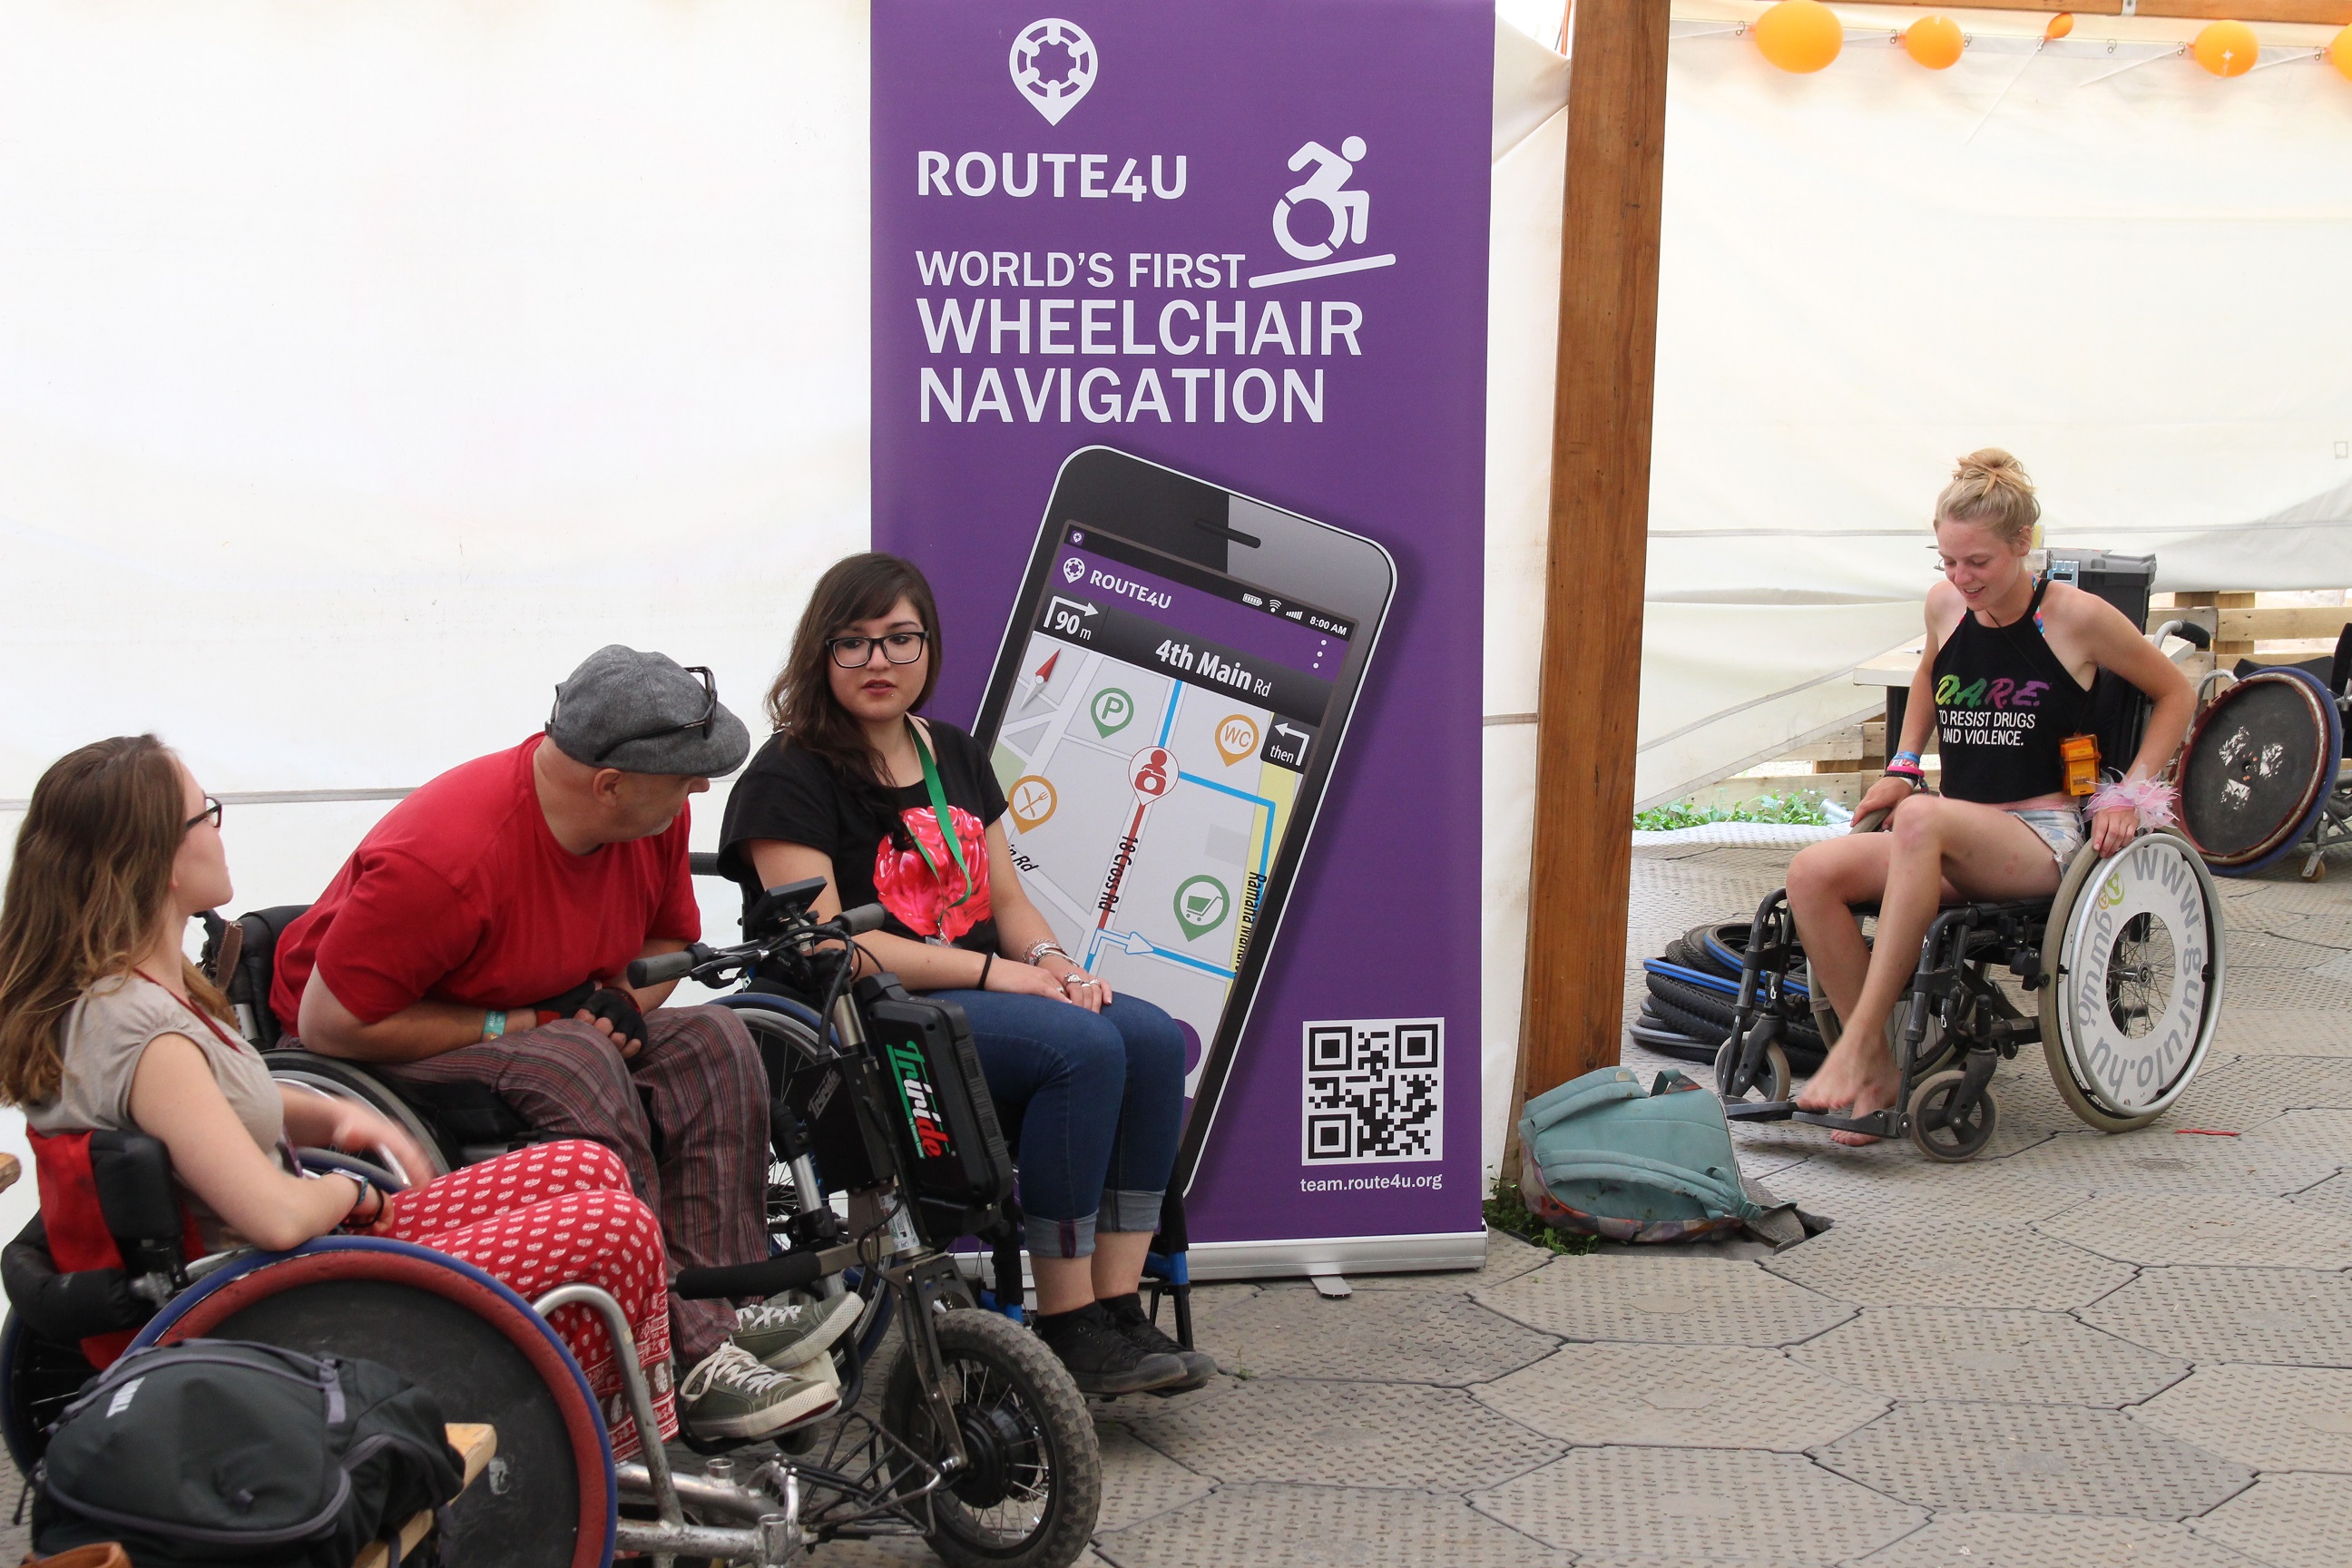
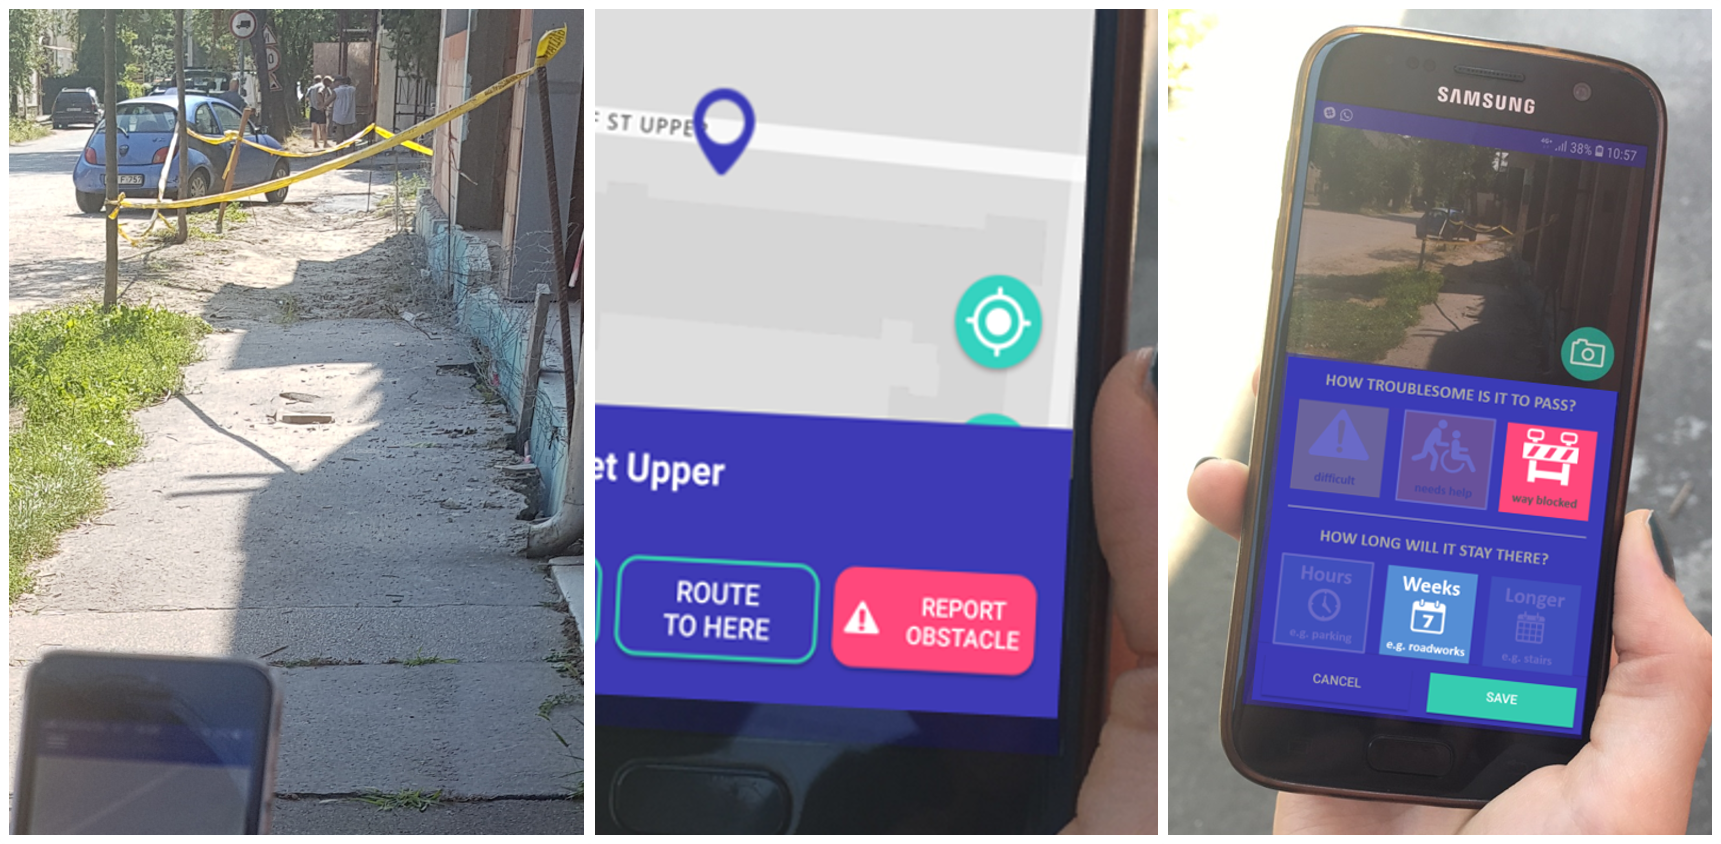
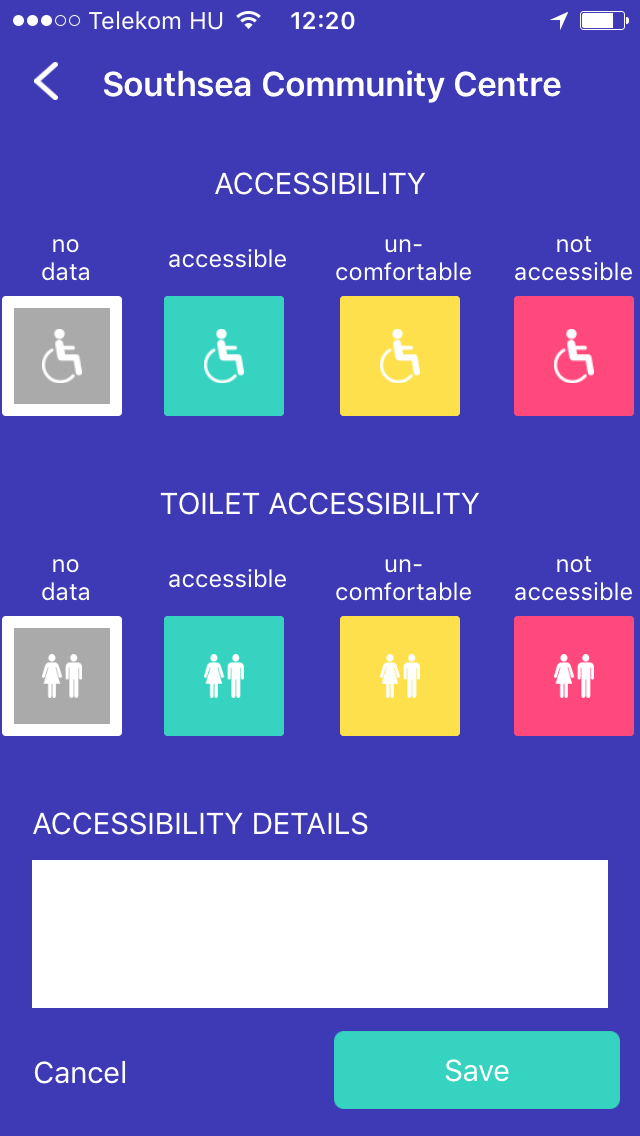
According to the very core concept of Route4U, data is collected from the crowd. Interestingly two third of the Route4U app users are fully abled people who are keen to help the community. Based on user interviews we learned that a good number of people are actively seeking volunteering possibilities. Many of them find the obstacle reporting and service accessibility rating functionality of Route4U app a highly appealing option for this, as it is really flexible both geographically and time-wise. This means, where-ever and whenever they have a couple of minutes to contribute to the common good it can be done with the app and the tool is always in their pockets. This is exactly why it caught the interest of many companies and organisations like the Docklands Business Forum in the Dublin Docklands area who are publicising this volunteering option amongst their staff and members. Which is again a good connection point to cities as they are hungrily seeking the information coming directly from their citizens so that they are able to make decisions which best serve their people.
25 times ’round the Globe
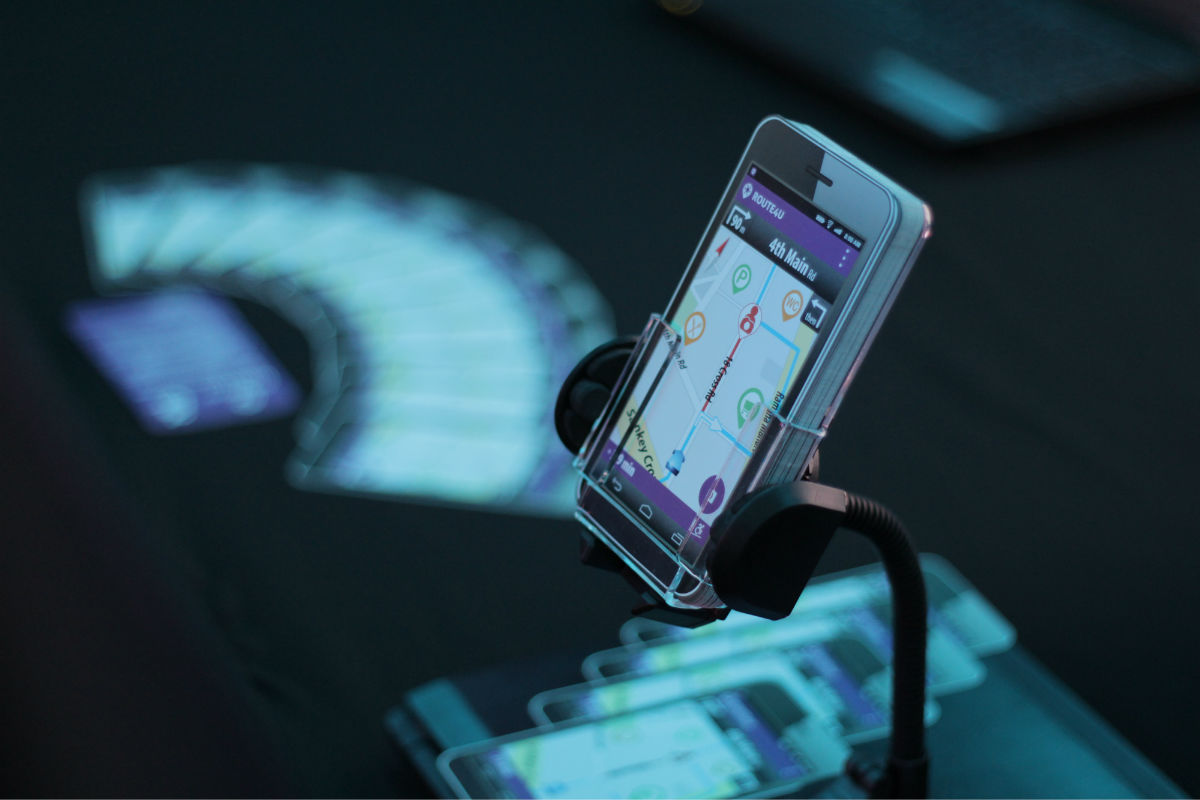
For reading this post this far you deserve a little peek under the hood. Interesting fact that to be able to provide the quality of analysis our customers enjoy in an average size of the downtown area (of approx. 500km sidewalk network) Route4U servers run more than 1 million kilometres of route planning – which equals with rounding the Globe 25 times along the Equator. But how are the walkability, rollability and inclusion indexes calculated?
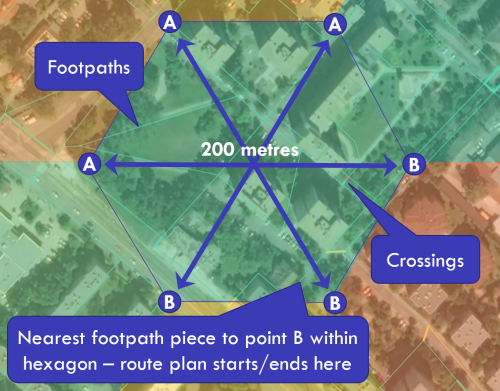
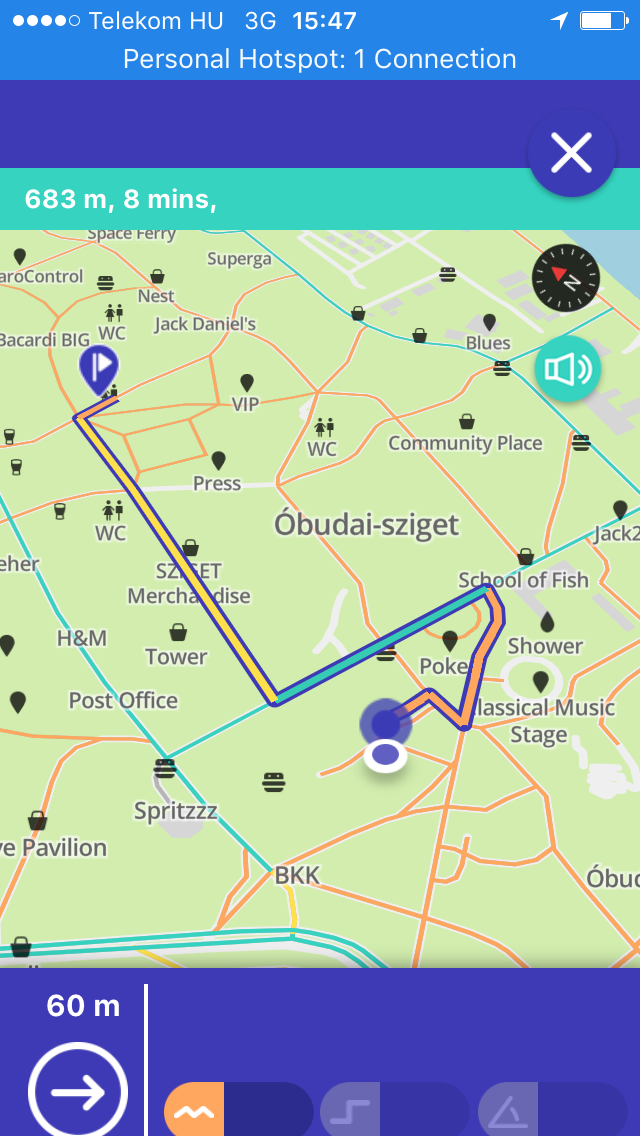
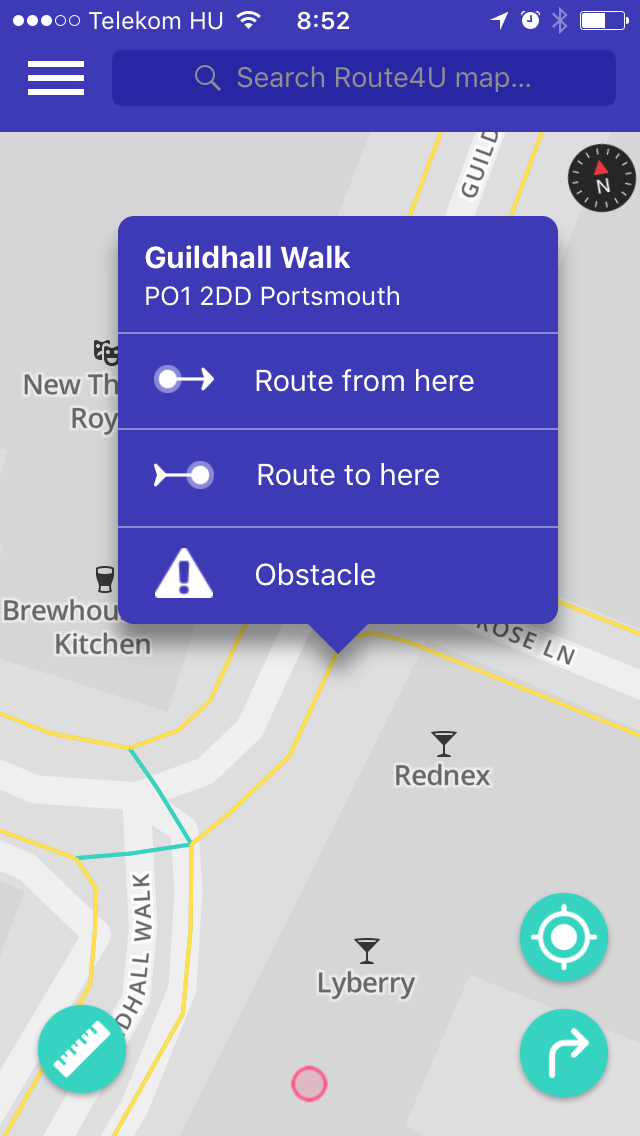
First, the surveyed area of the city is broken up into hexagons of 200 metres in diameter and ‘A’ and ‘B’ points are assigned to the corners of each hexagon. Following this, routes are planned – there and back – between A and B points on the footpath network. The starting and ending points are always the nearest footpath segments to A and B (as A and B points may not always be on a piece of footpath).
Thus we get to a number which shows that in the small neighbourhood of a hexagon how long a distance one should walk (or roll in a wheelchair) on the footpath network to get from A to B which is 200 metres as the crow flies. (For easier visualisation, in the end, we give the figure for 100 metres straight line on our maps instead of 200 metres). The inclusion index is the difference of walkability and rollability and it shows how discriminating the area is for wheelchairs.
How does this help?
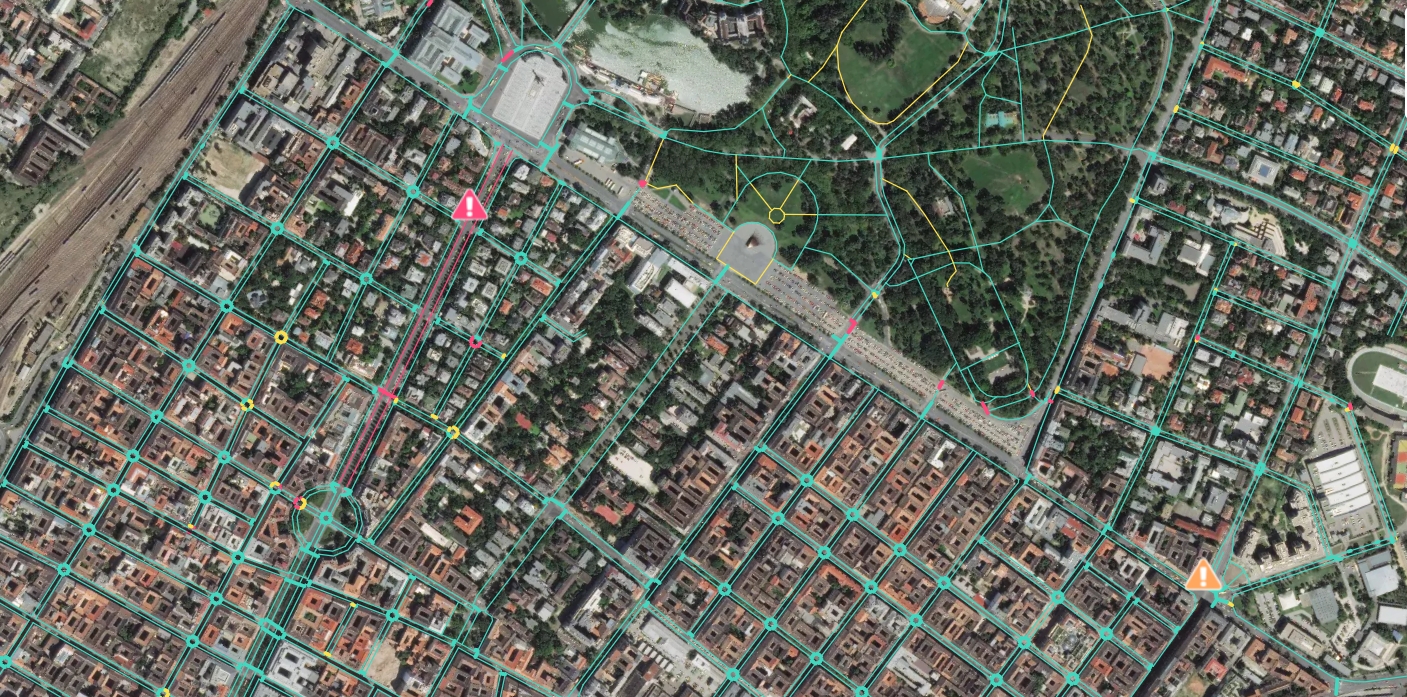
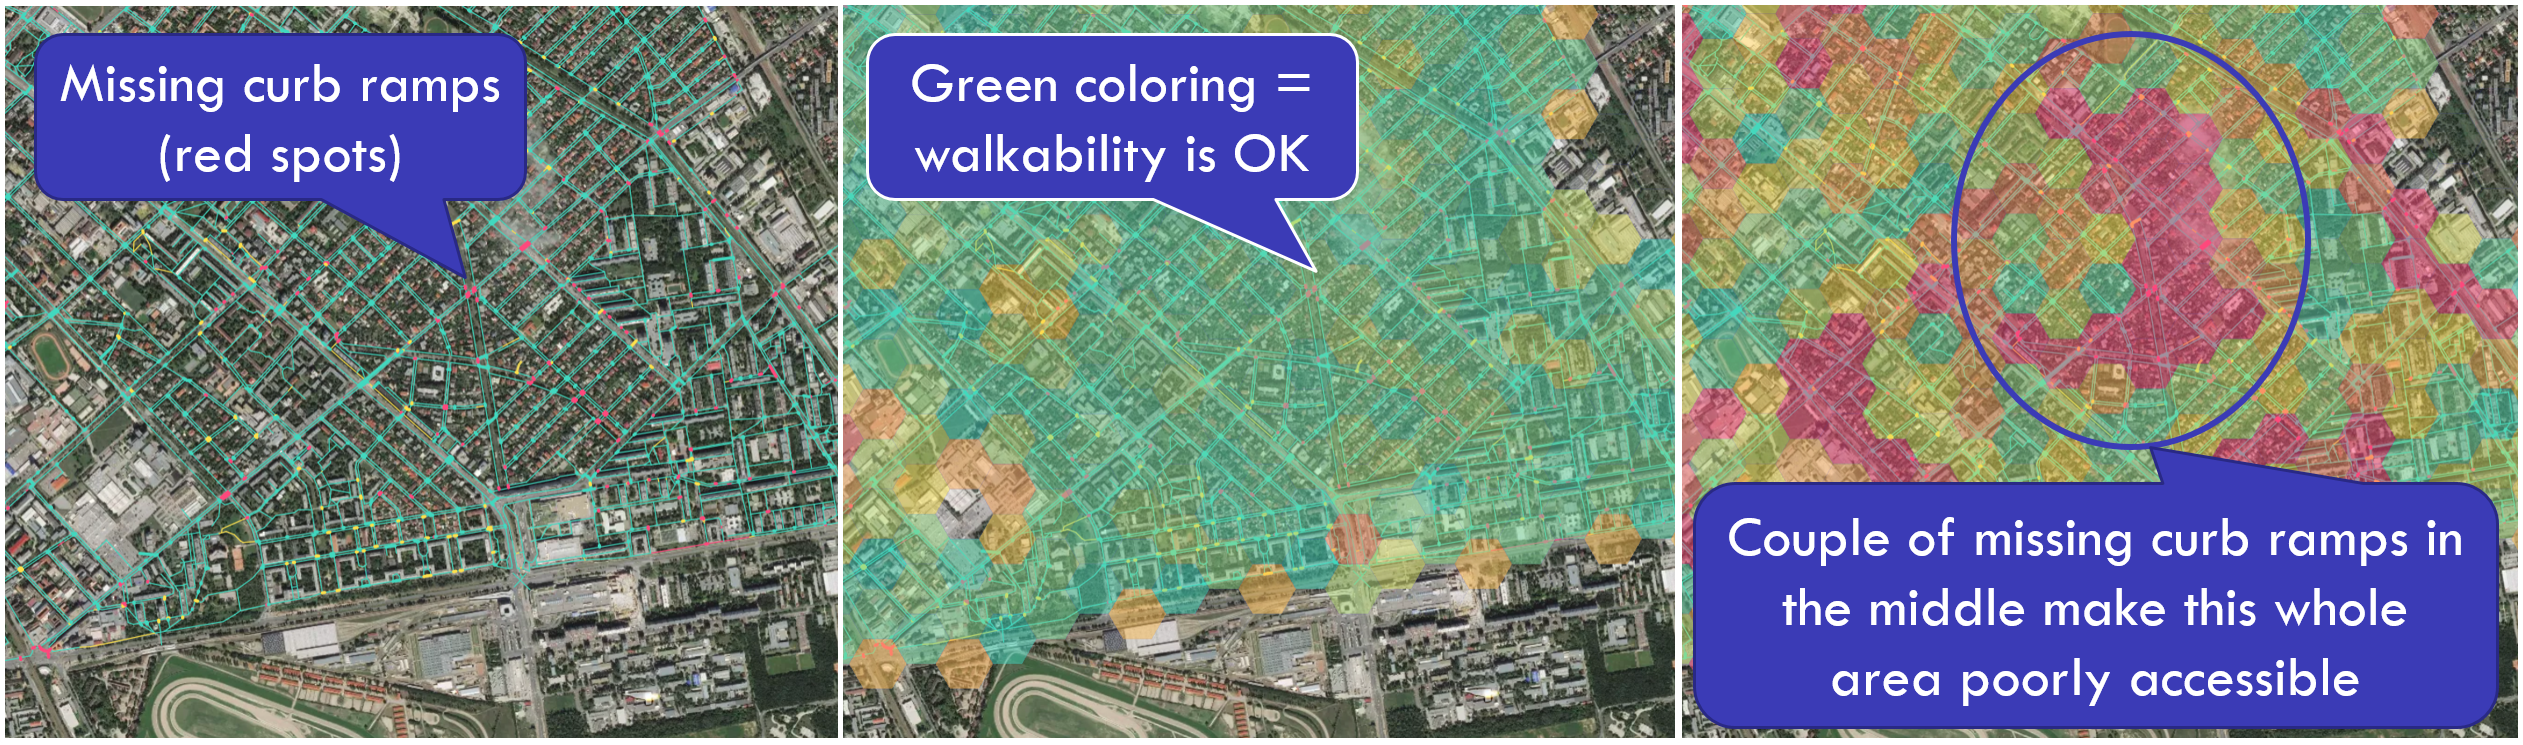
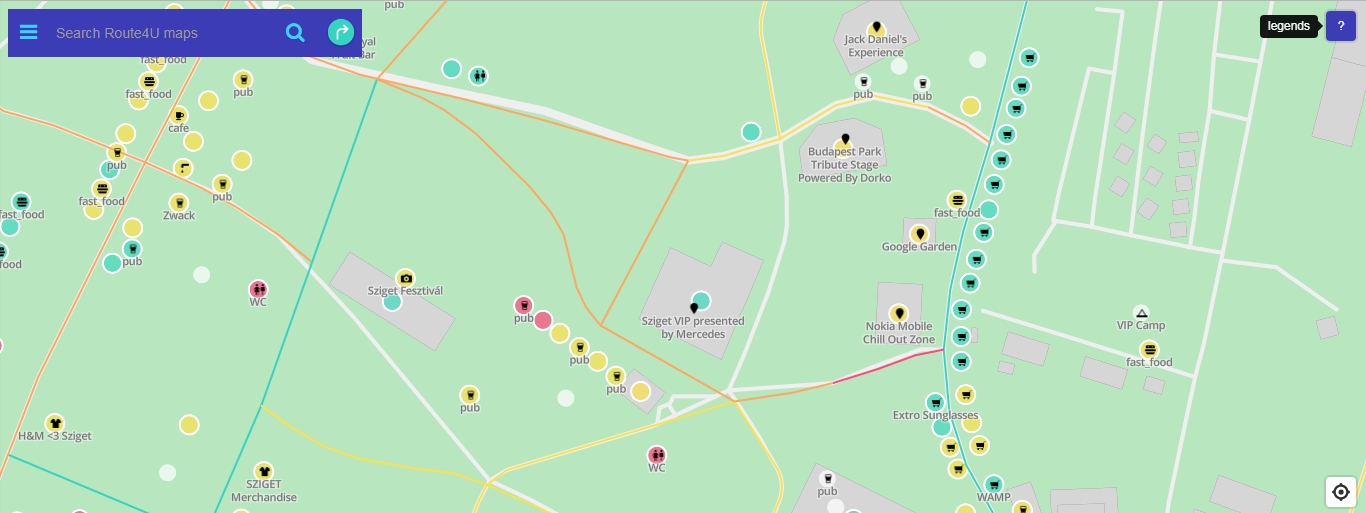
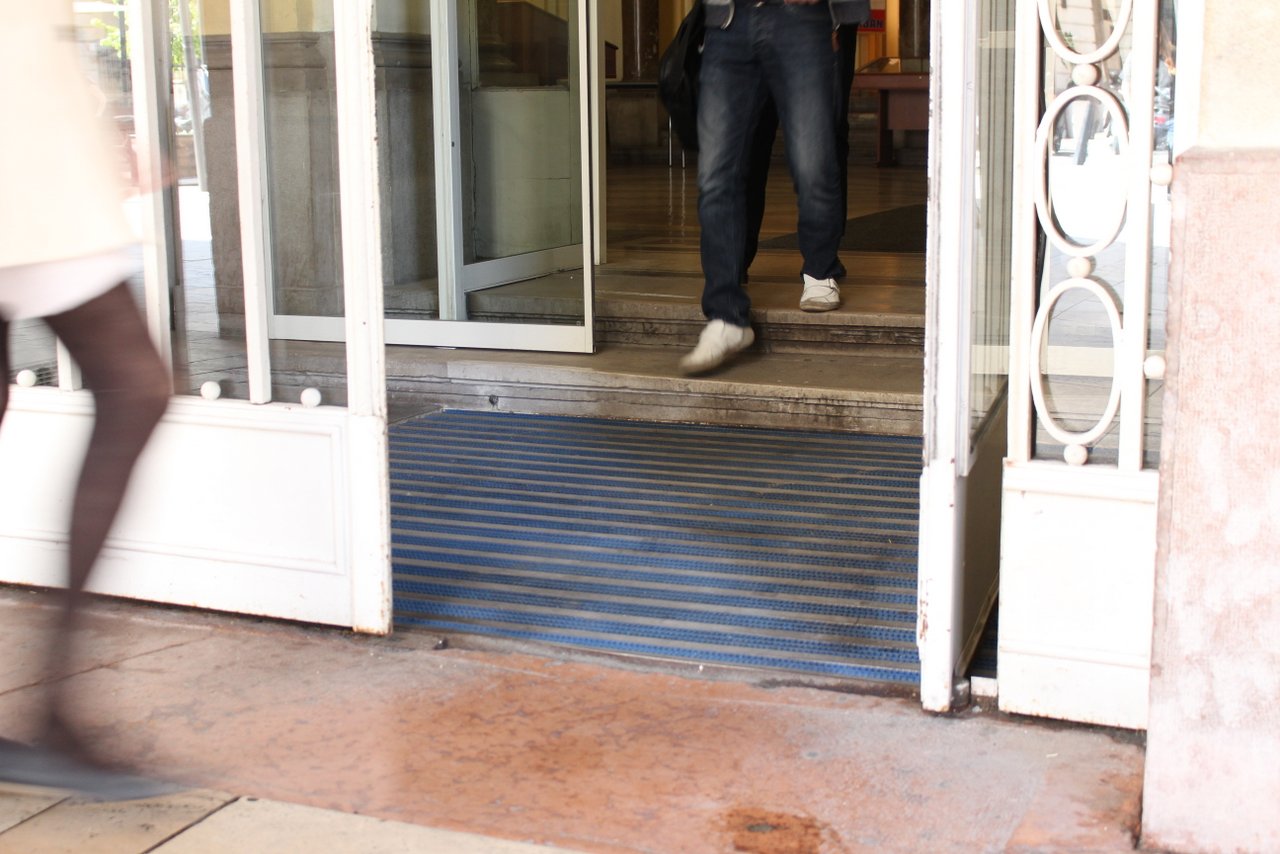
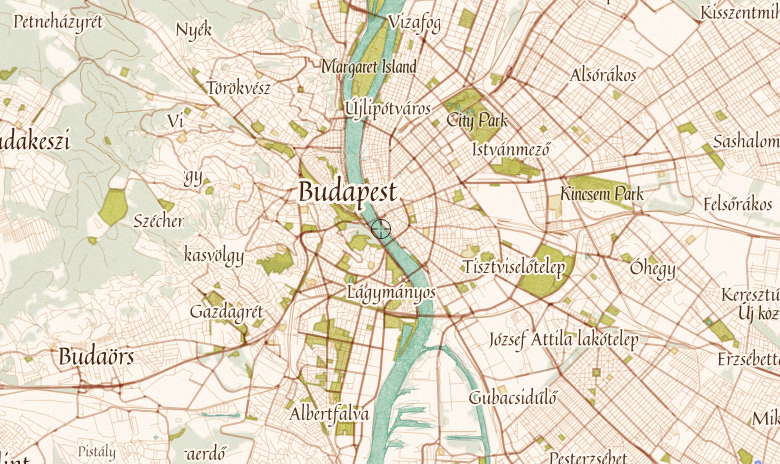
With this tool, it is easy to identify the problematic areas and then – digging a little deeper – also the causes of the problems. City planners of a client in Budapest, for example, were surprised to realise how much effect a couple of missing but important curb ramps have on the whole network in a rather extended area.
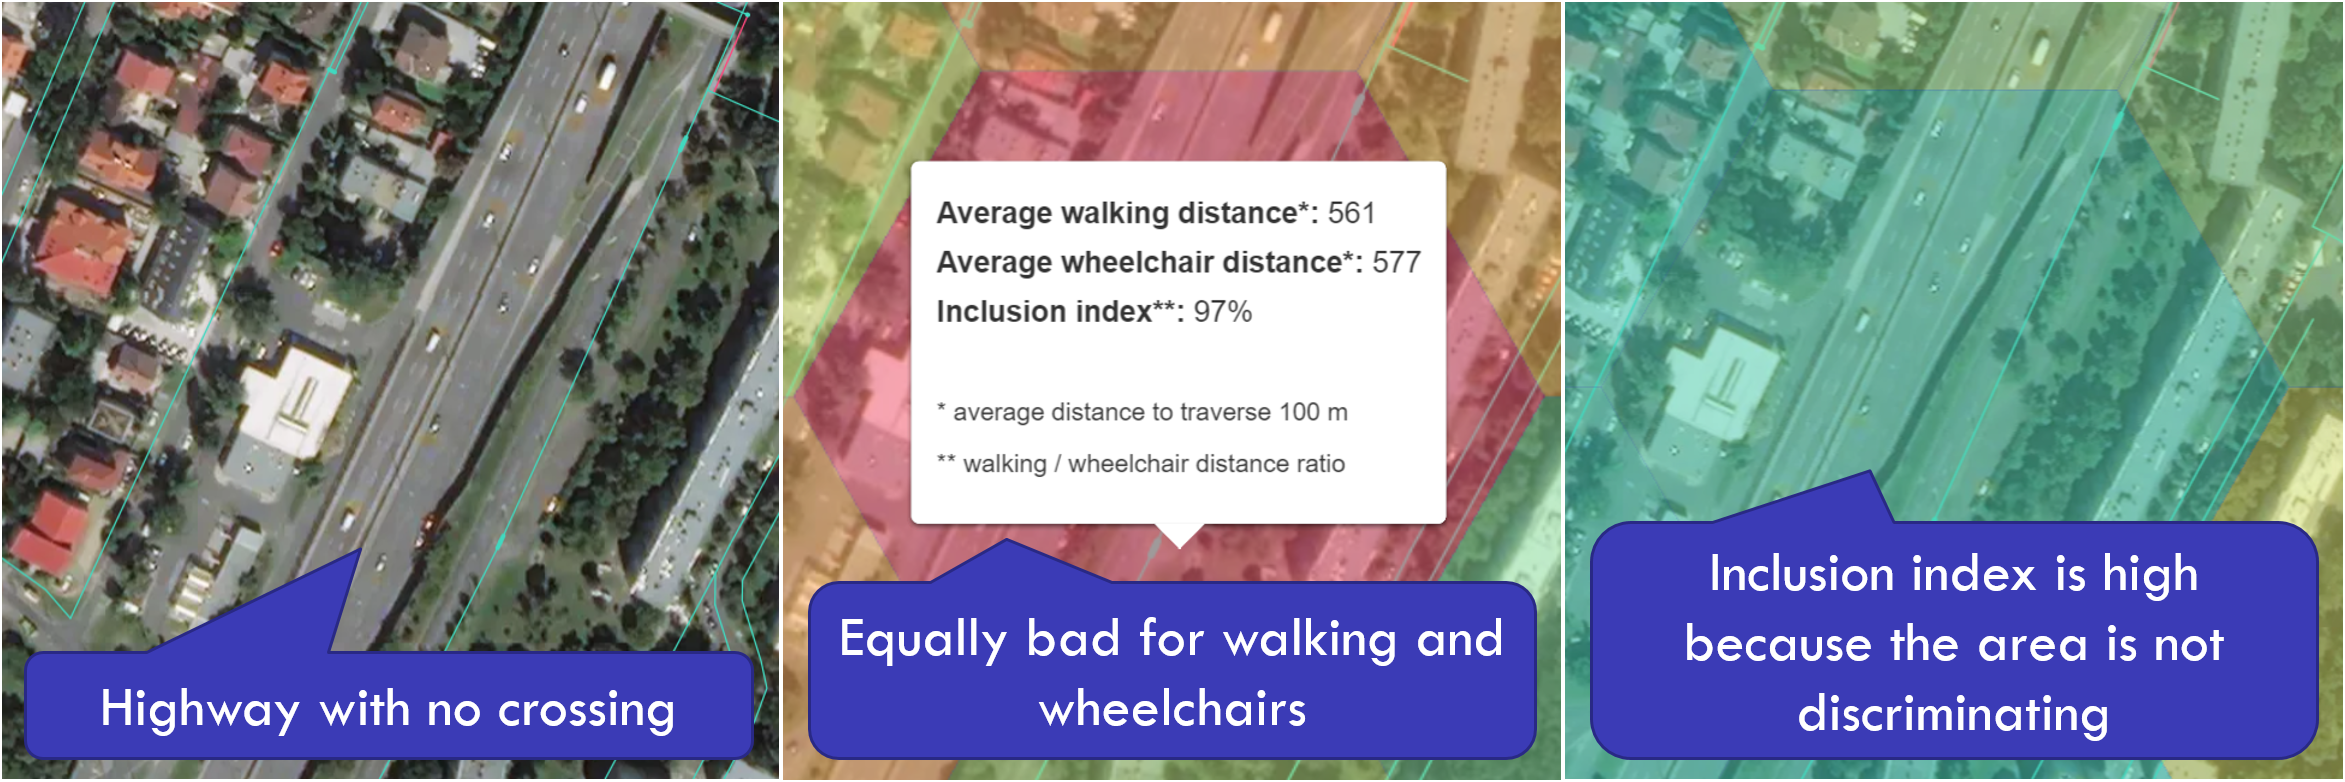
It was also interesting to see how a missing bridge or under-path across a highway that splits the district into two destroys walkability. To traverse 100 meters one must walk more than 500. Of course, in this case, the same applies to wheelchair users so the area is not discriminating since it is equally bad for everyone.
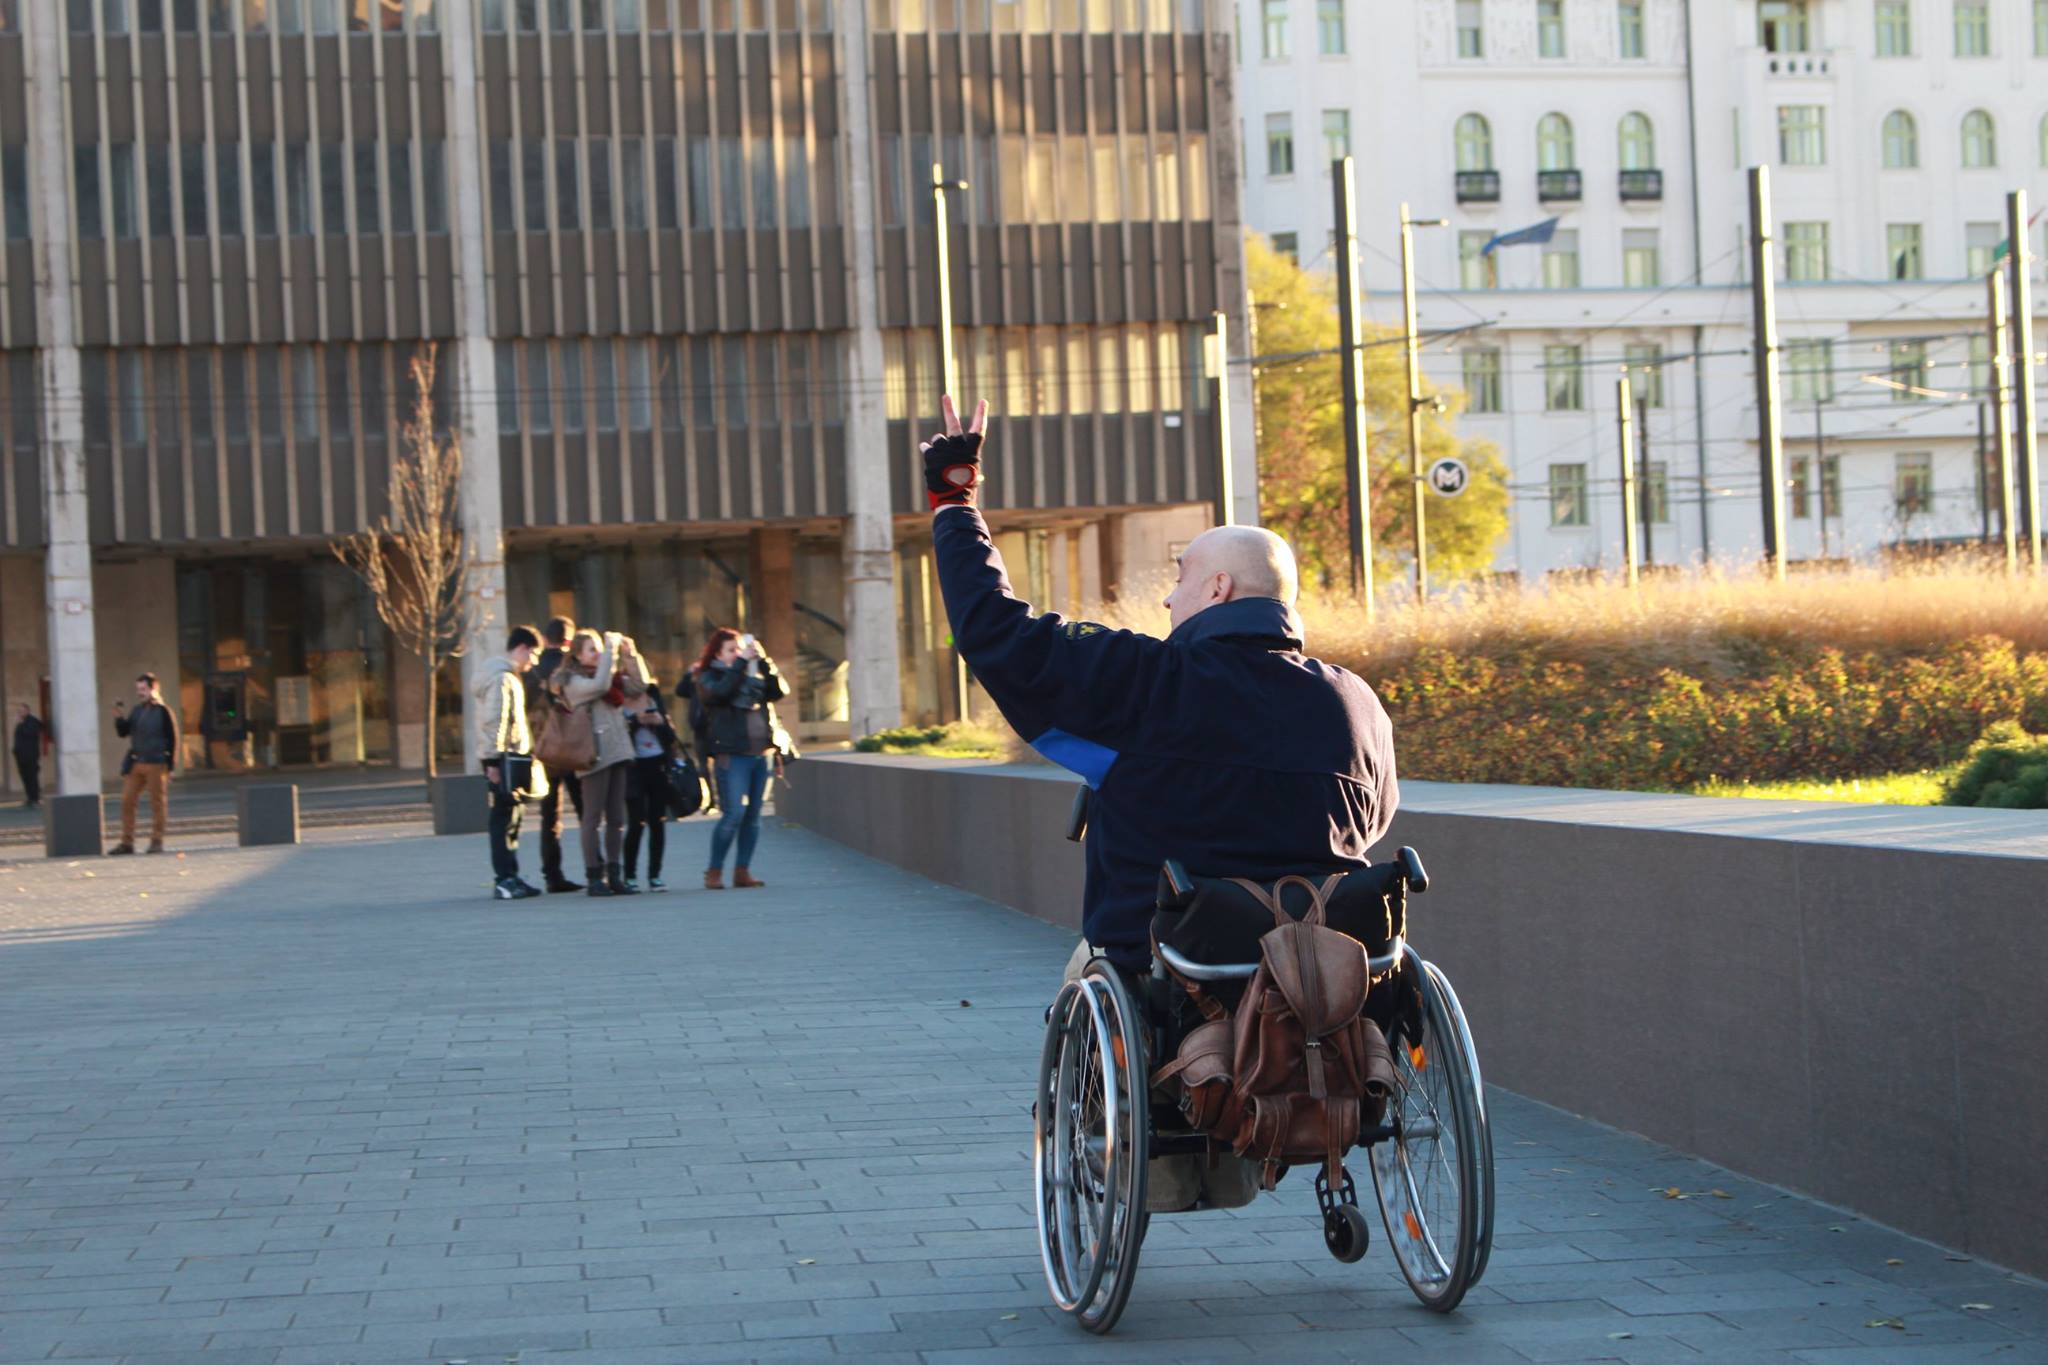
Based on all this, city decision-makers can virtually play around with their sidewalk infrastructure and experiment with different development options to see which ones would result in the greatest improvement regarding the overall network. And it is needless to say that the wiser our tax money is spent the better we are all off. Therefore we highly encourage you to volunteer, download the Route4U app and spend two-three minutes each day to upload some data. With this you are not only helping wheelchair users to a higher level of freedom in their mobility but also helping your city to make smarter decisions and to build a safer and more comfortable footpath network for all.


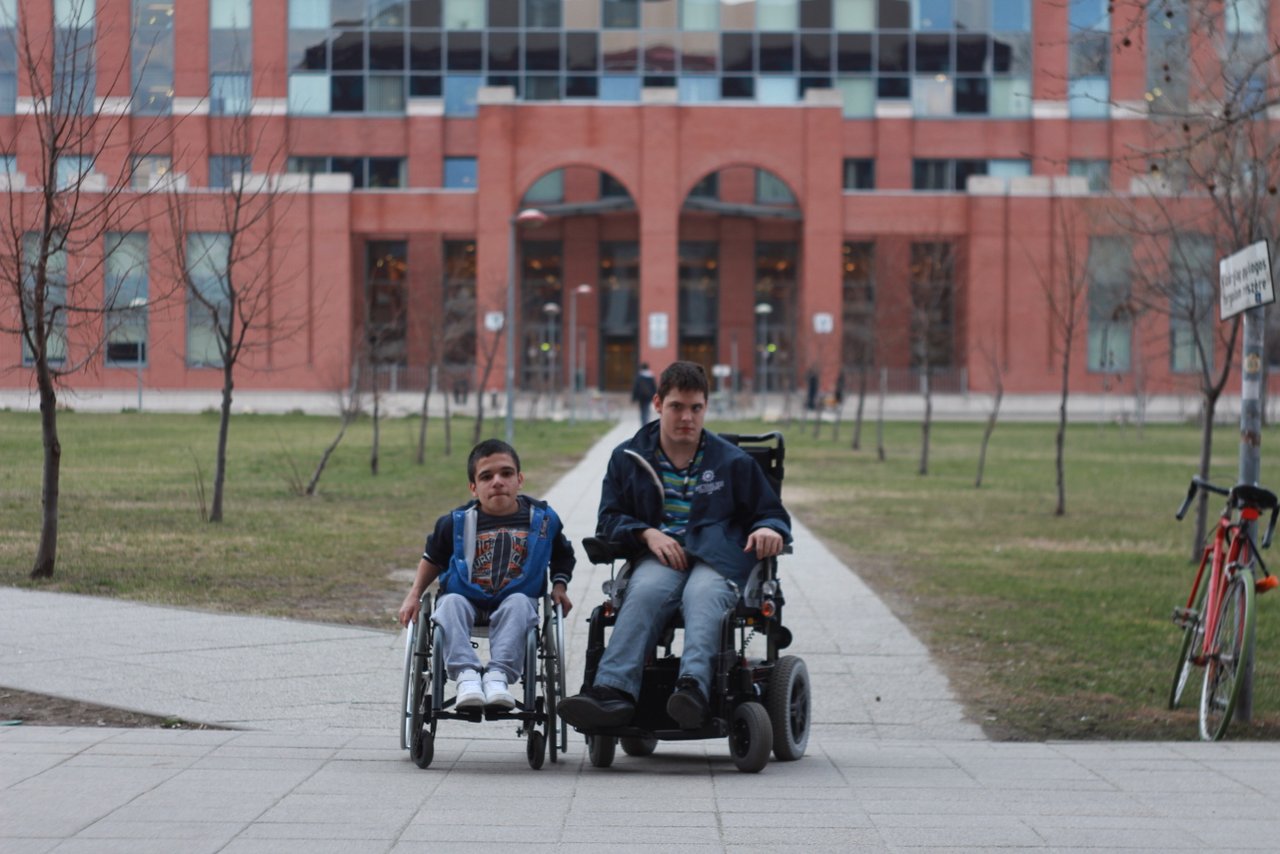
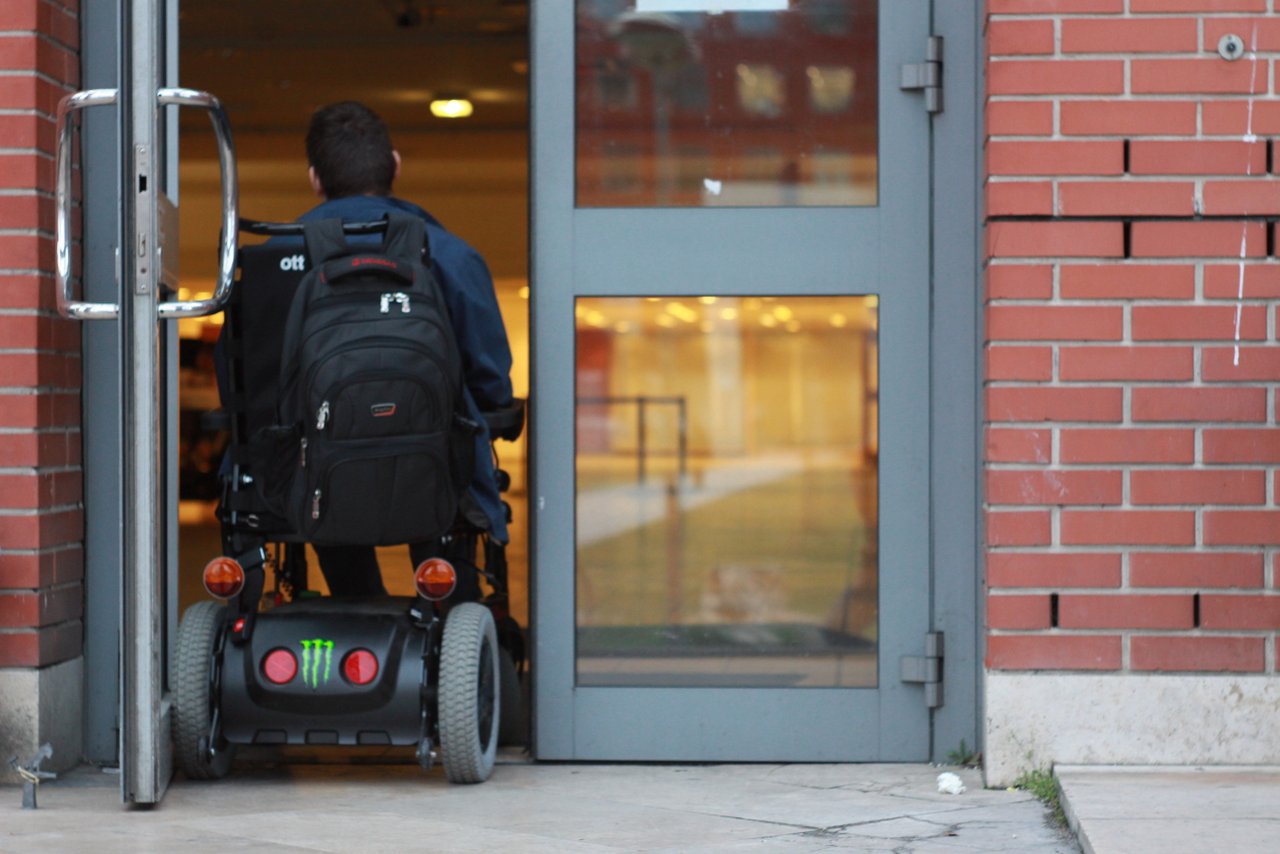
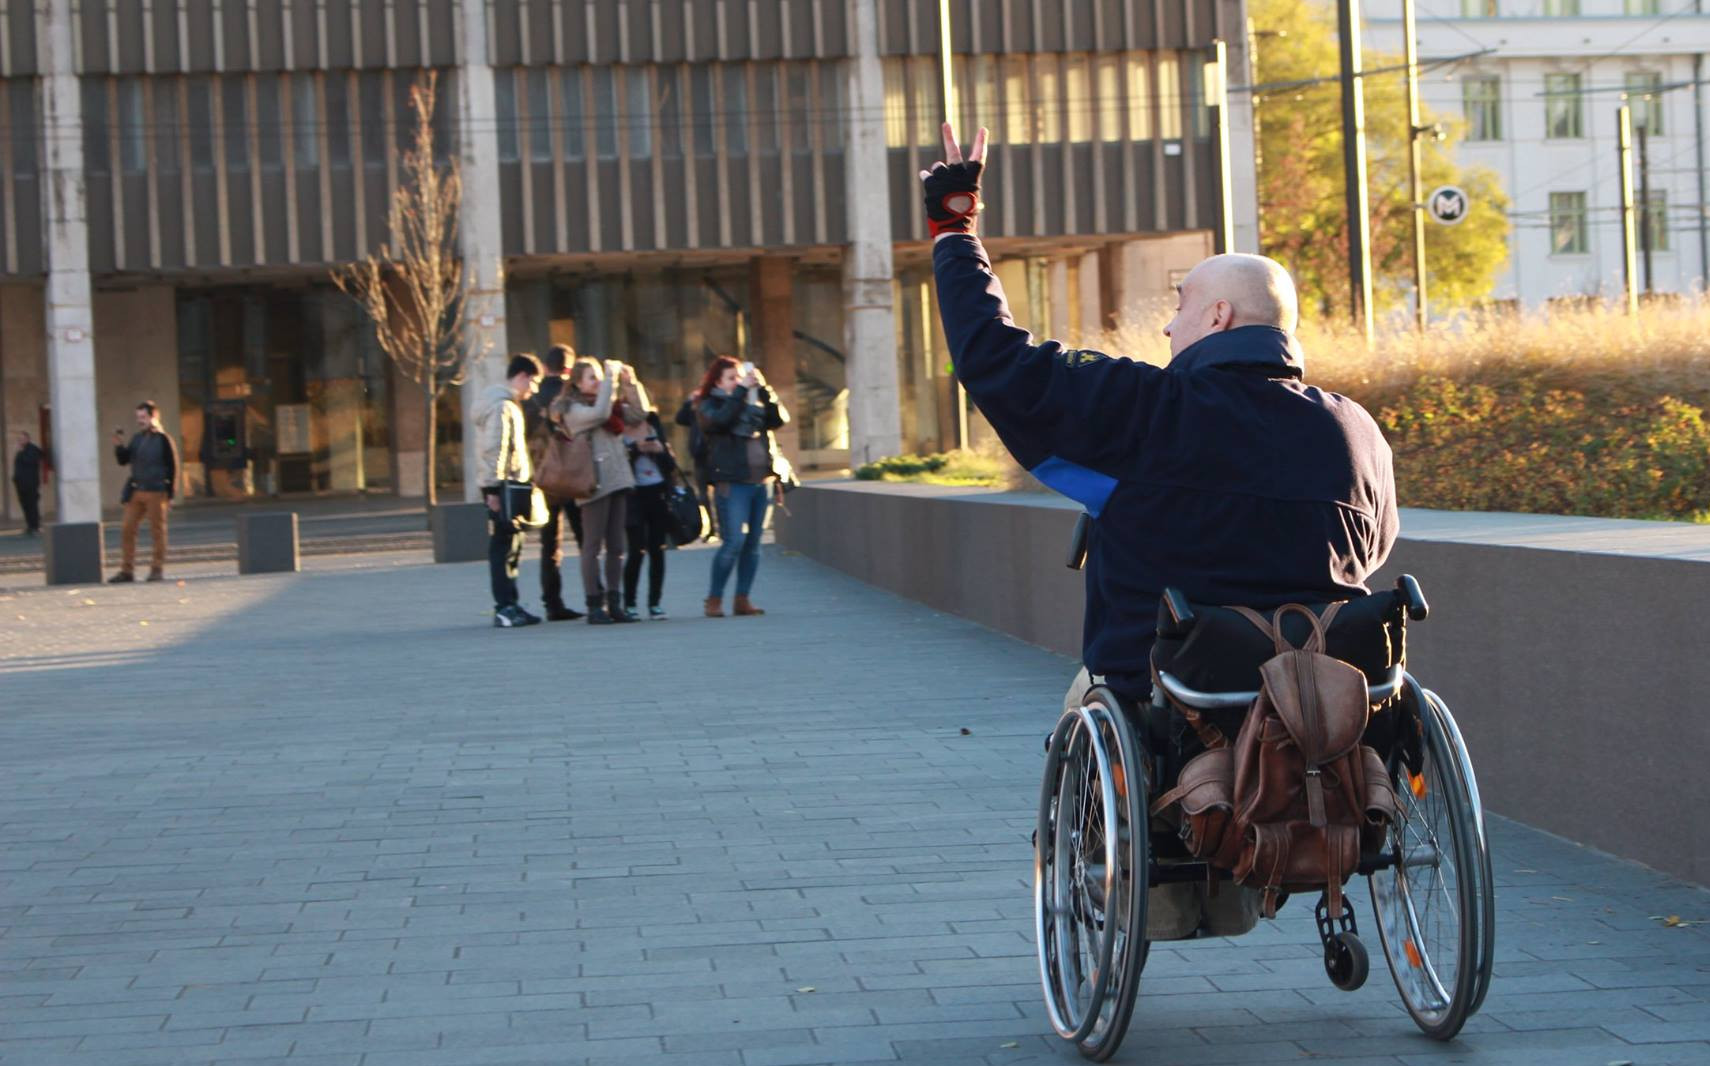


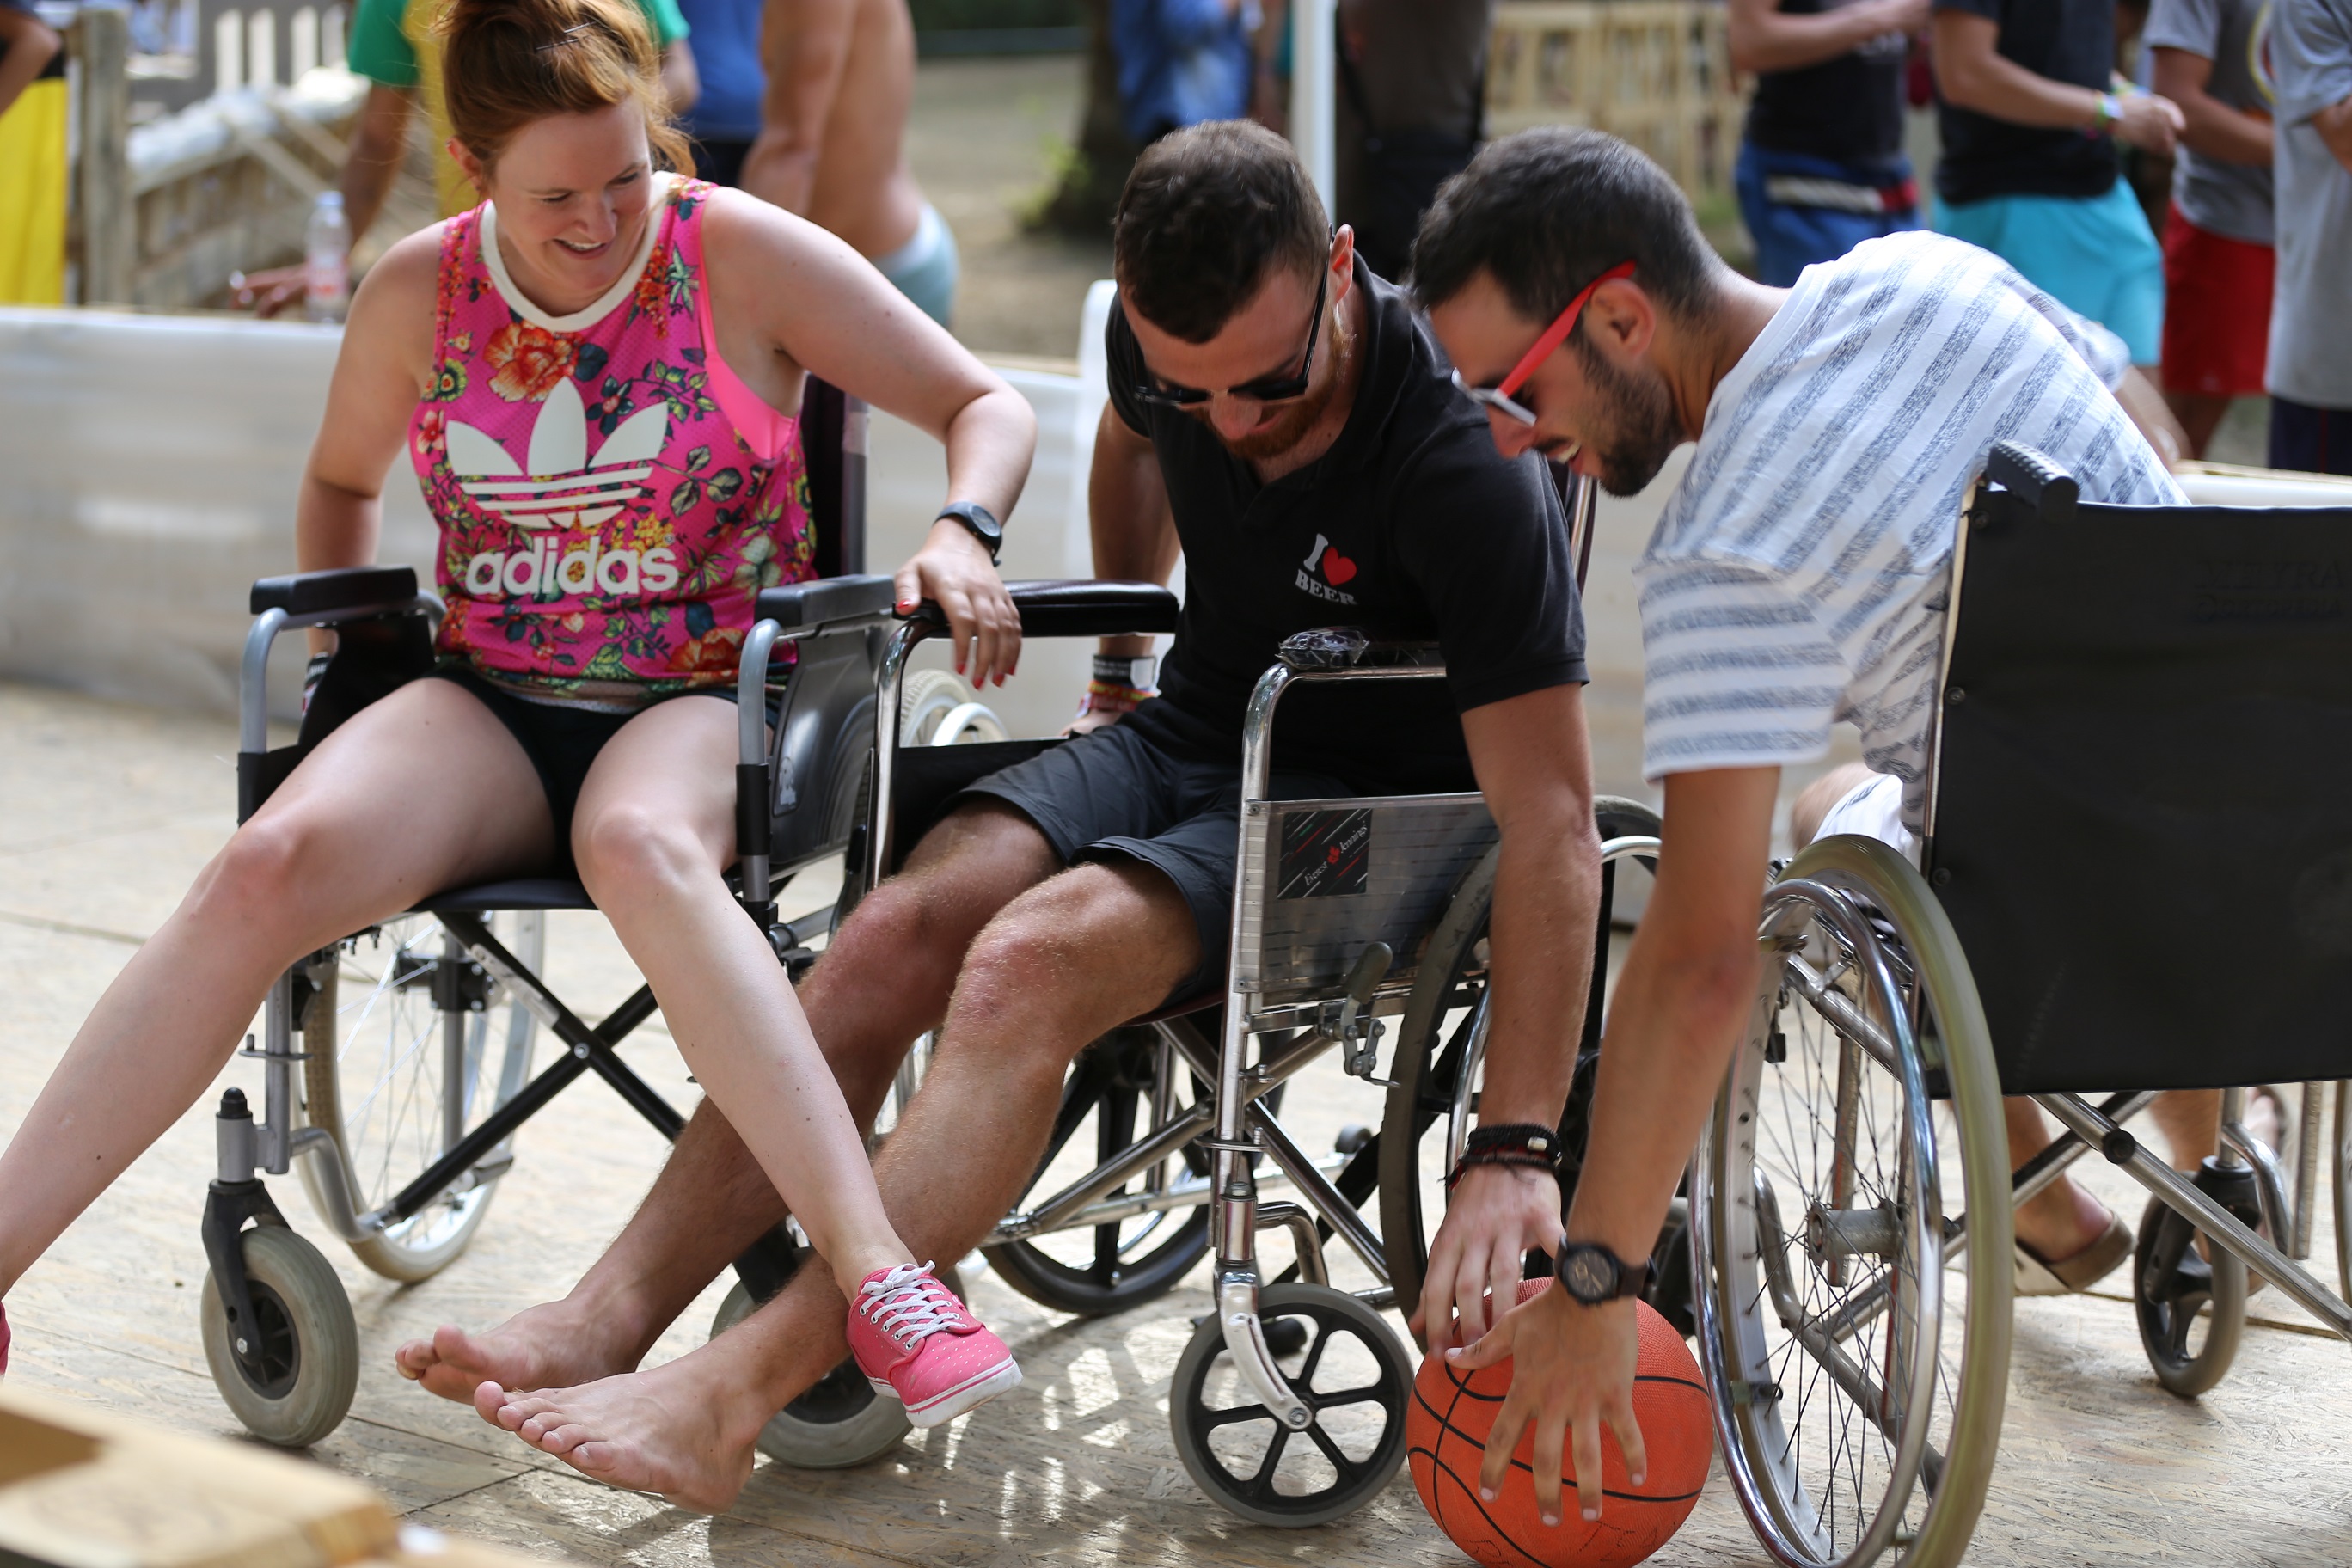
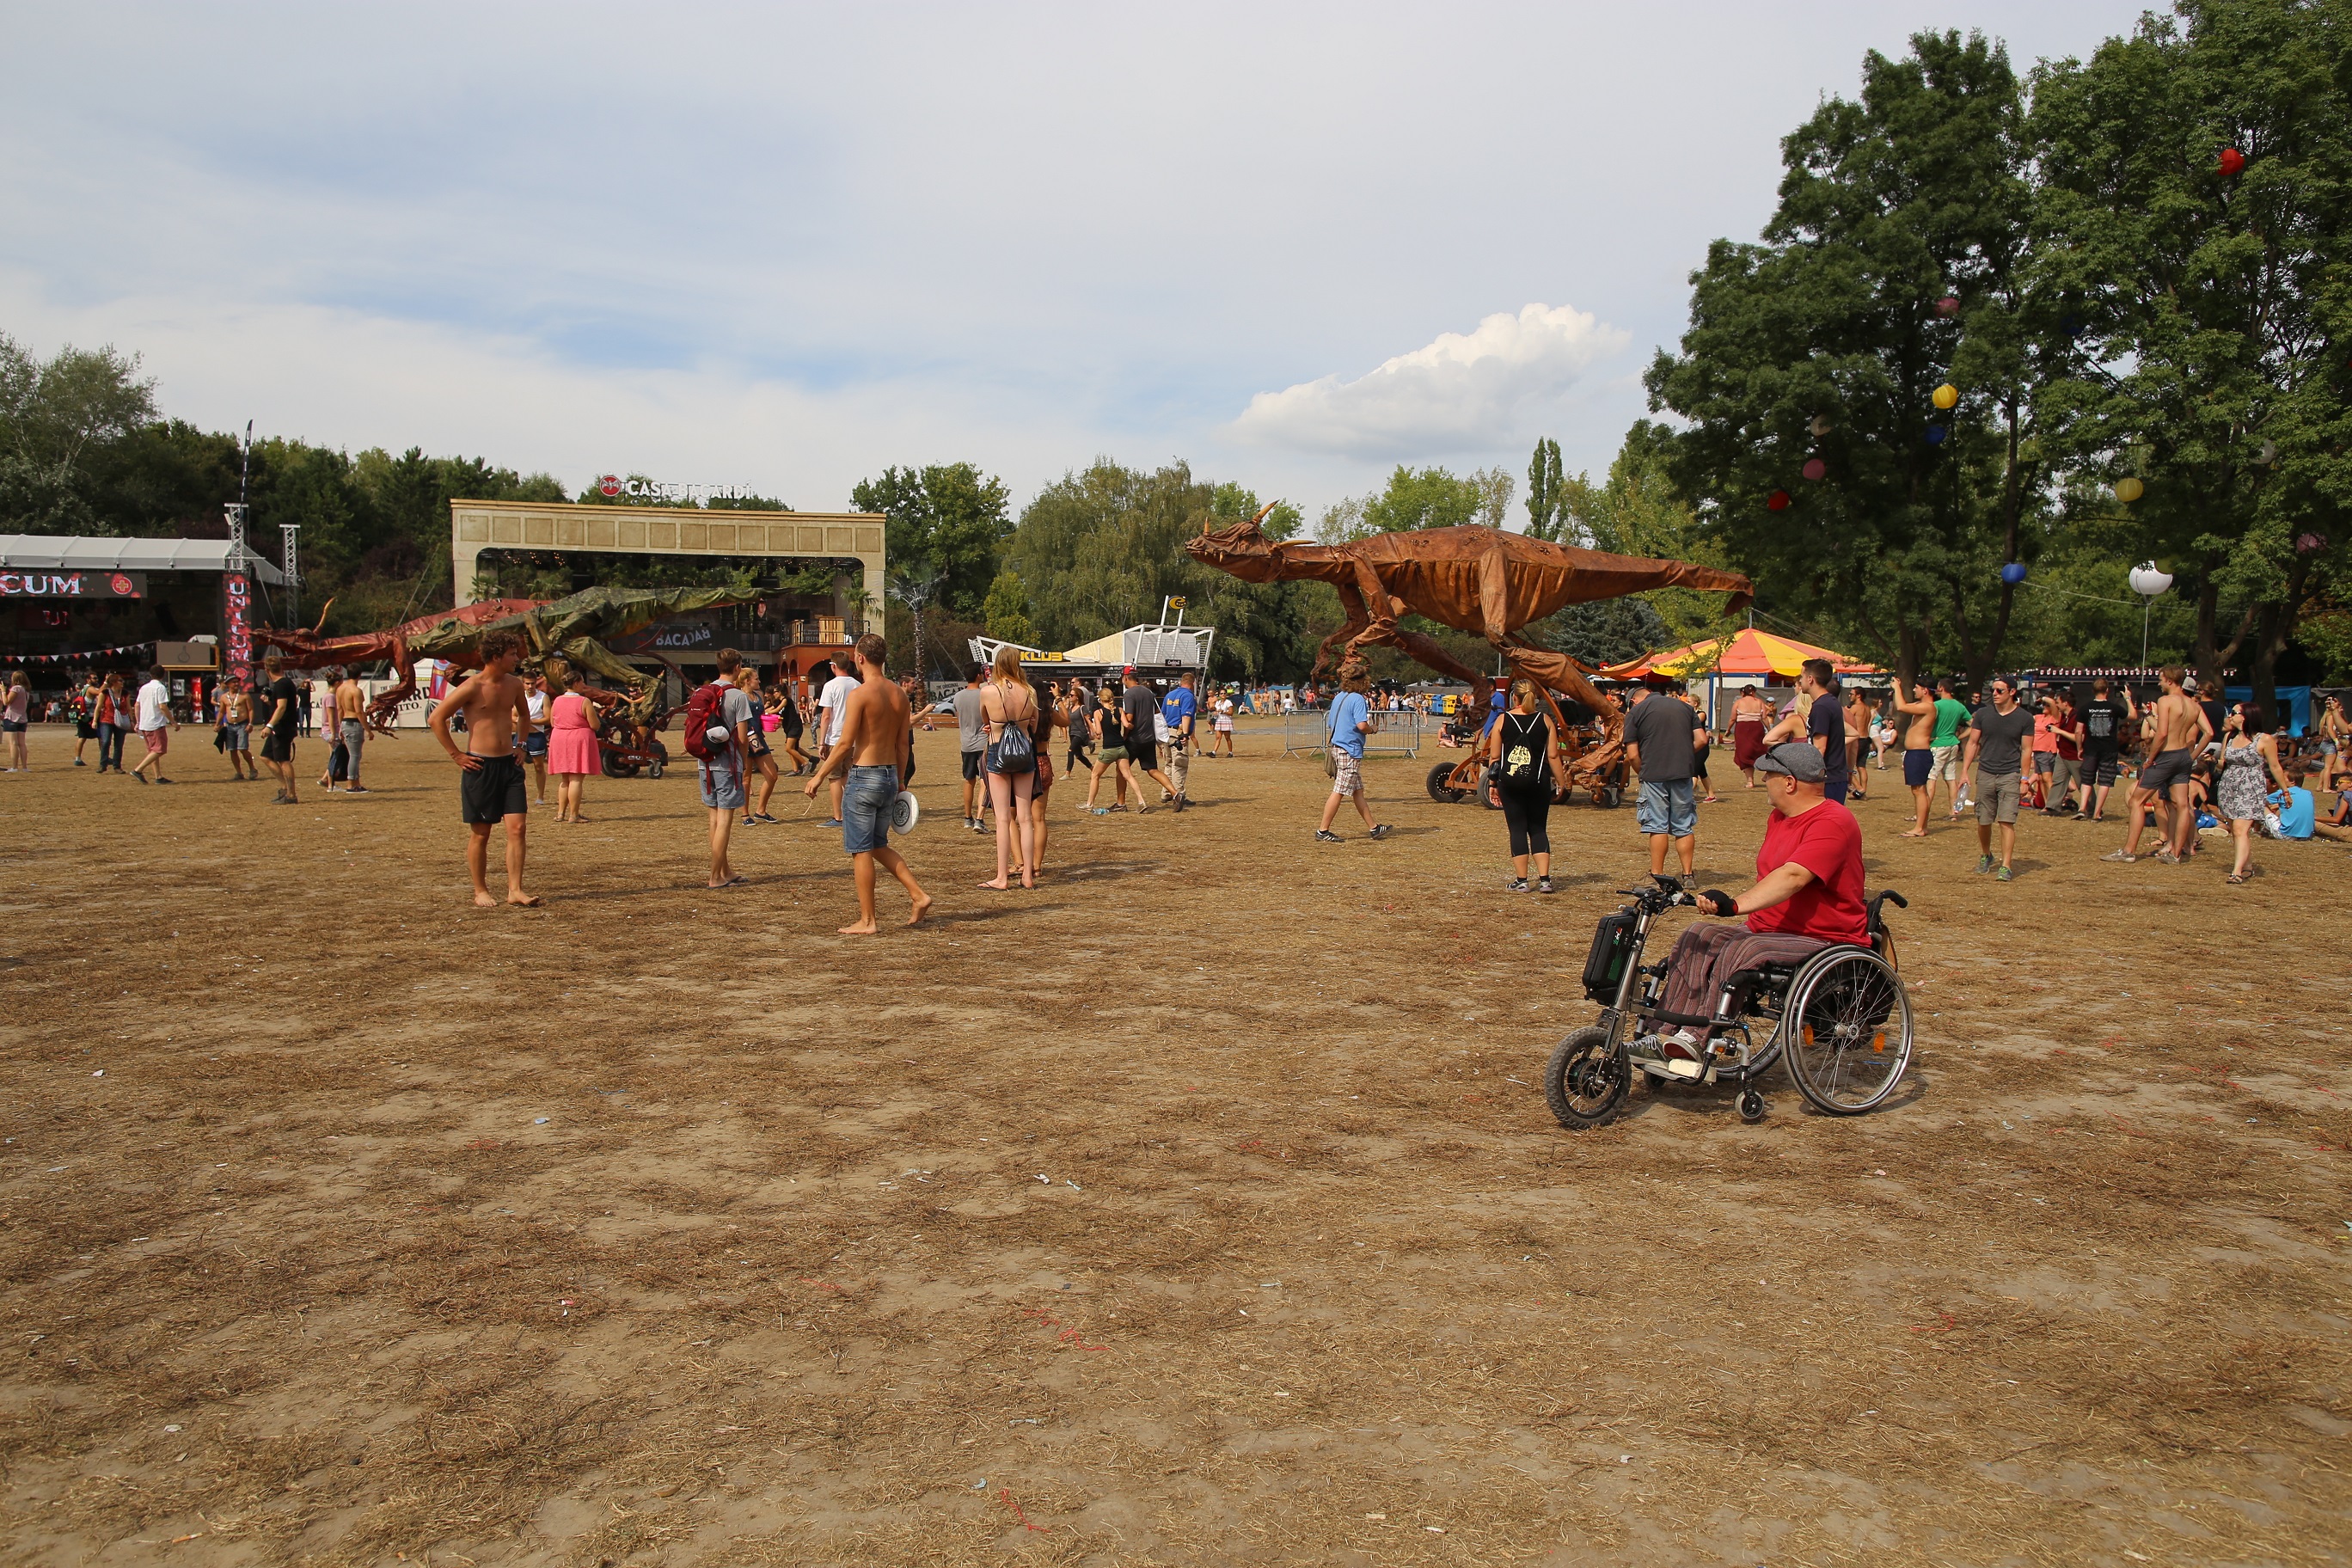
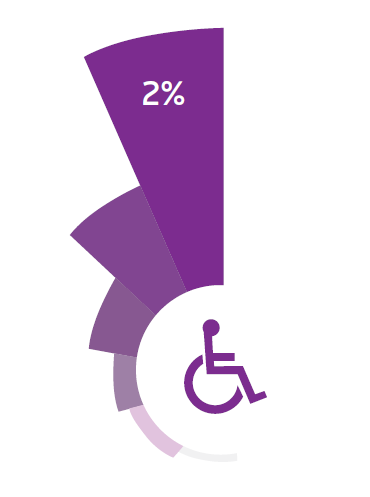 Today 2% of Hungary’s population is with reduced mobility. In towns and cities – since conditions are better – their percentage of the population is even higher. Based on census data, only 7% of working-age disabled people work. This puts huge stress on society. Another, Western European survey’s results show that more than 50% of non-working people with disabilites would love to, if the conditions were sufficient. Younger generations’ access to accessible education helps them grow into adults actively helping society, even on the job market.
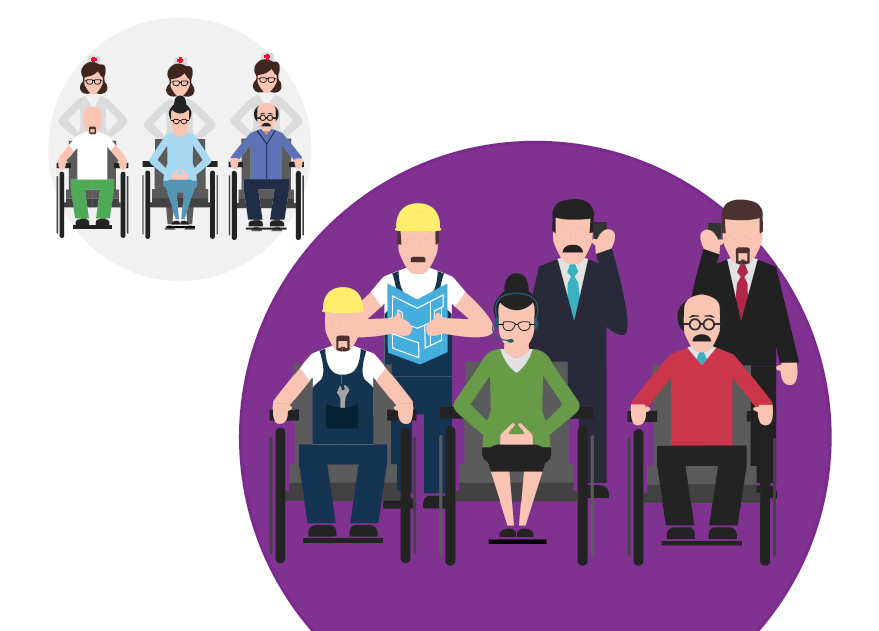
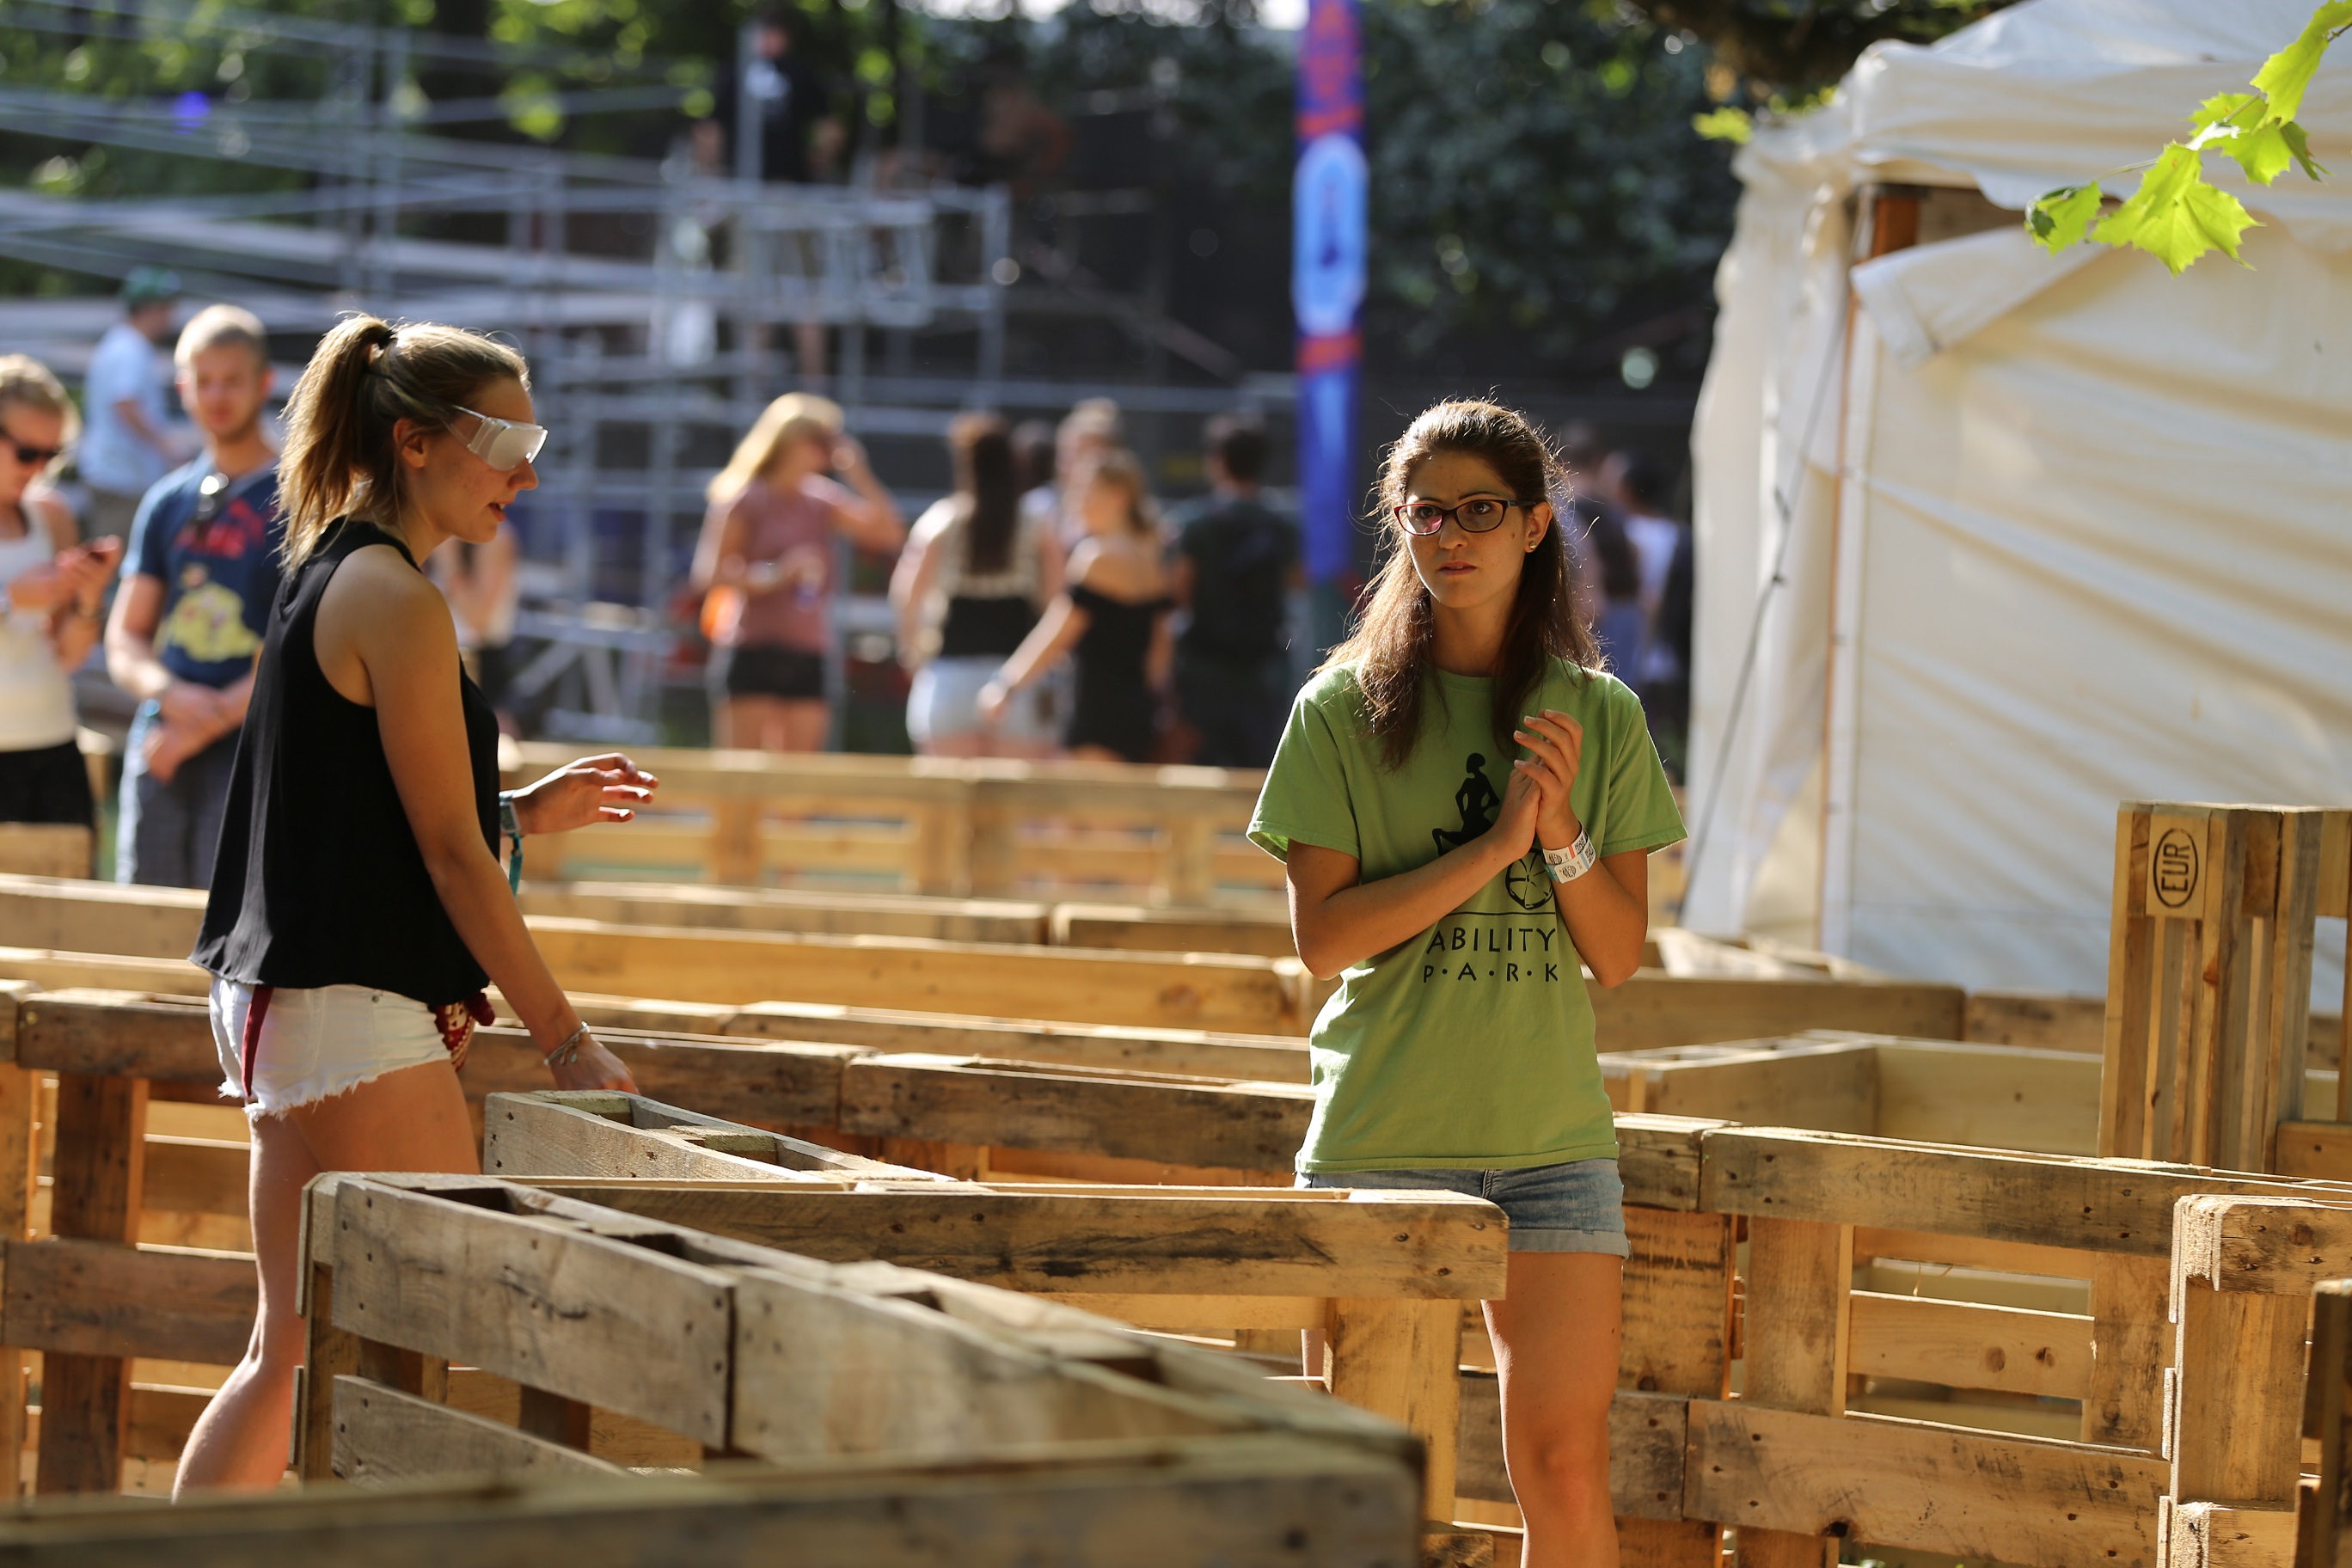
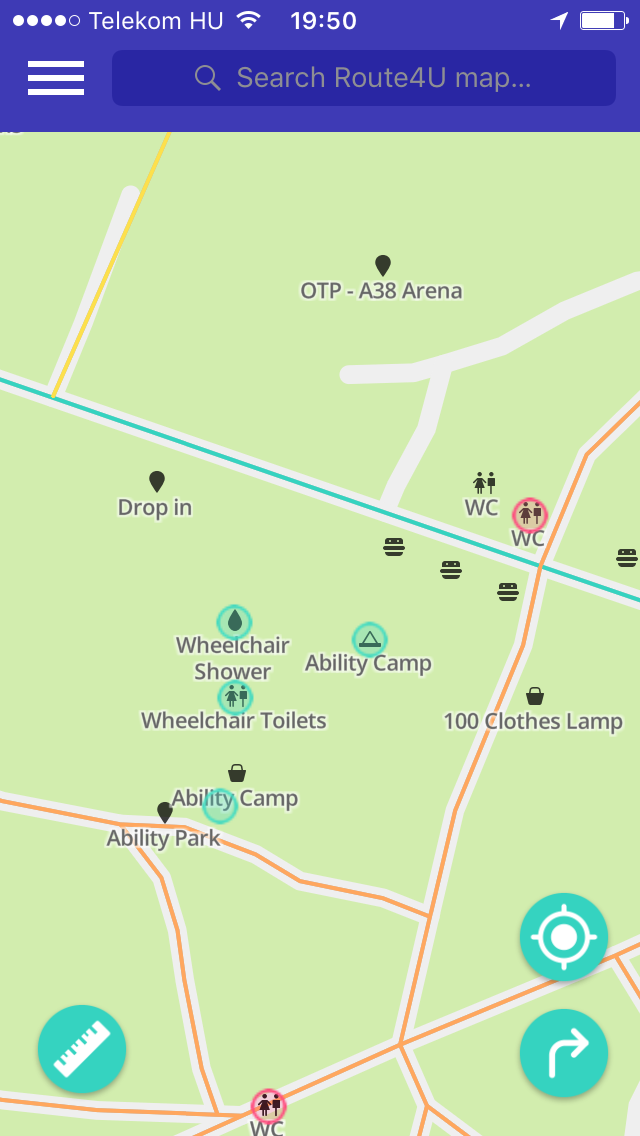
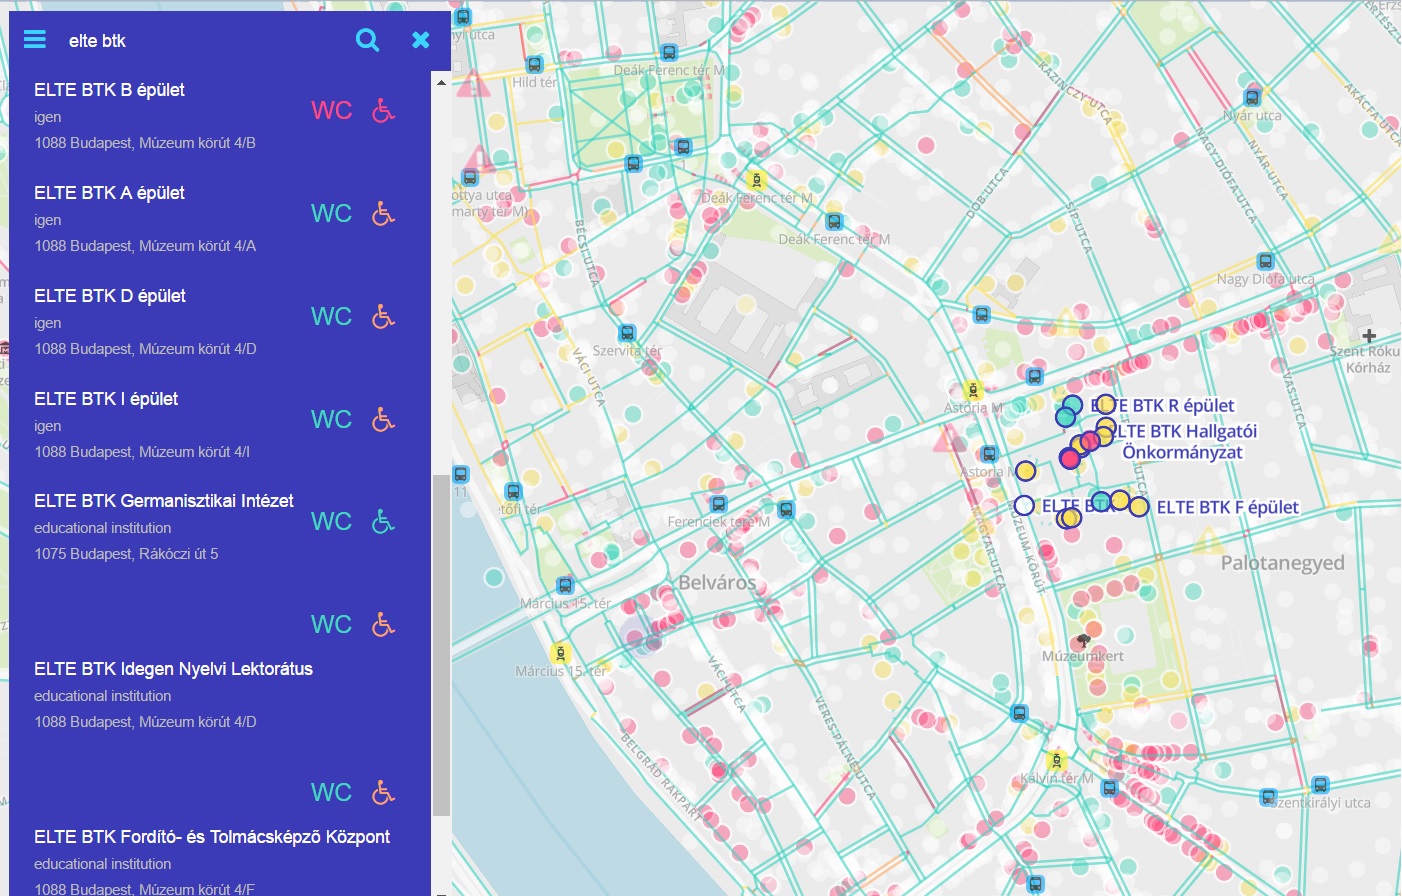
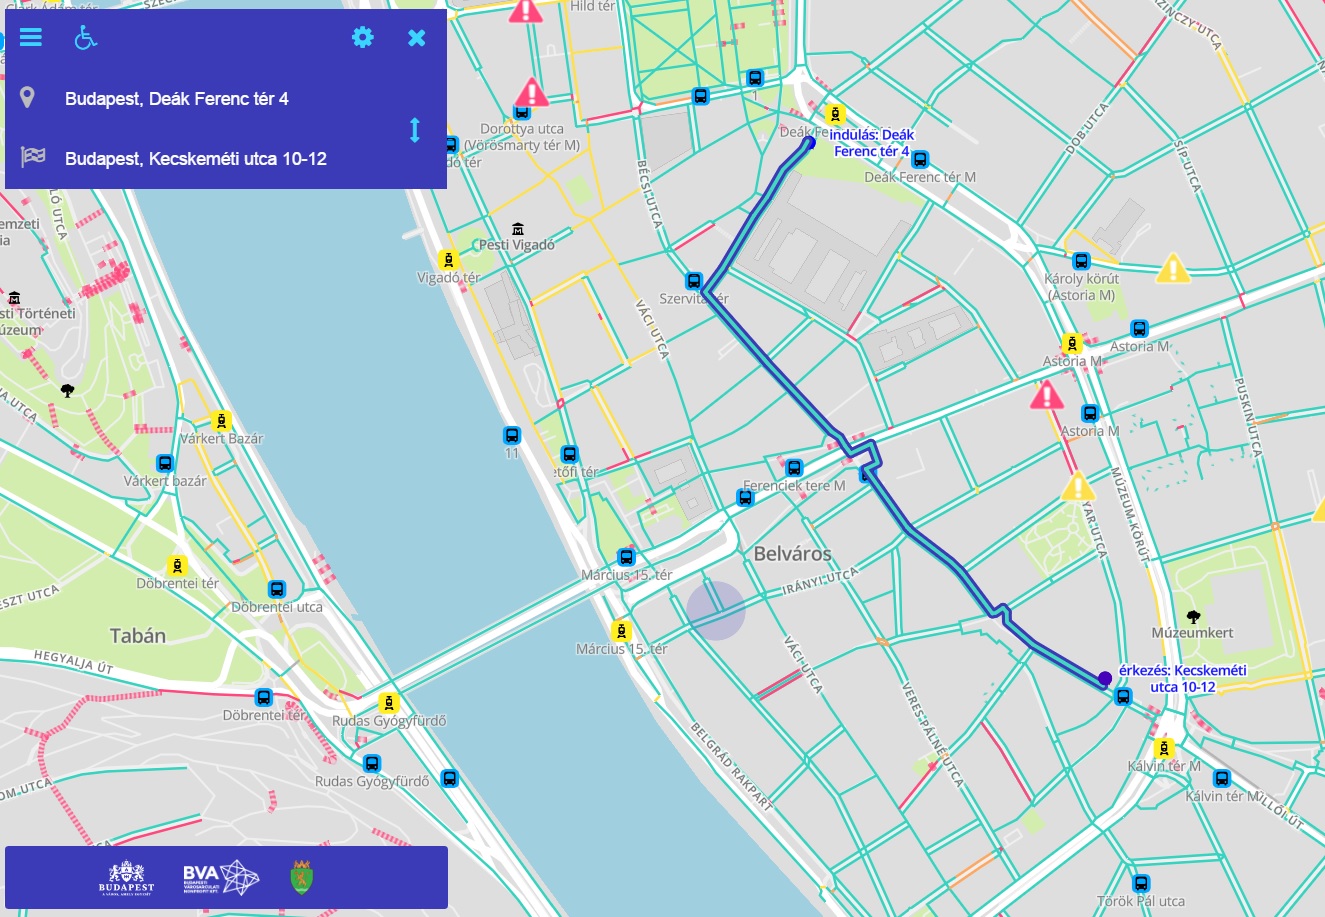
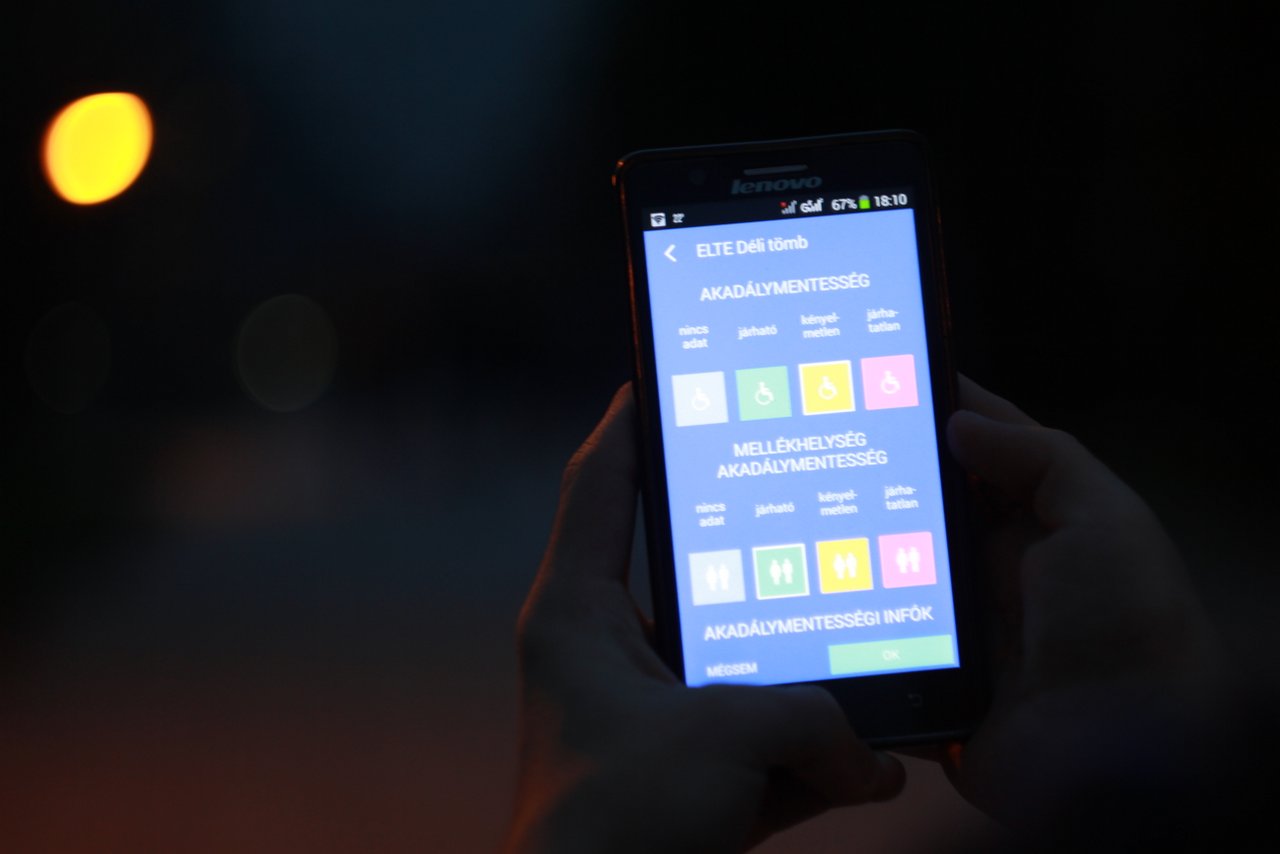
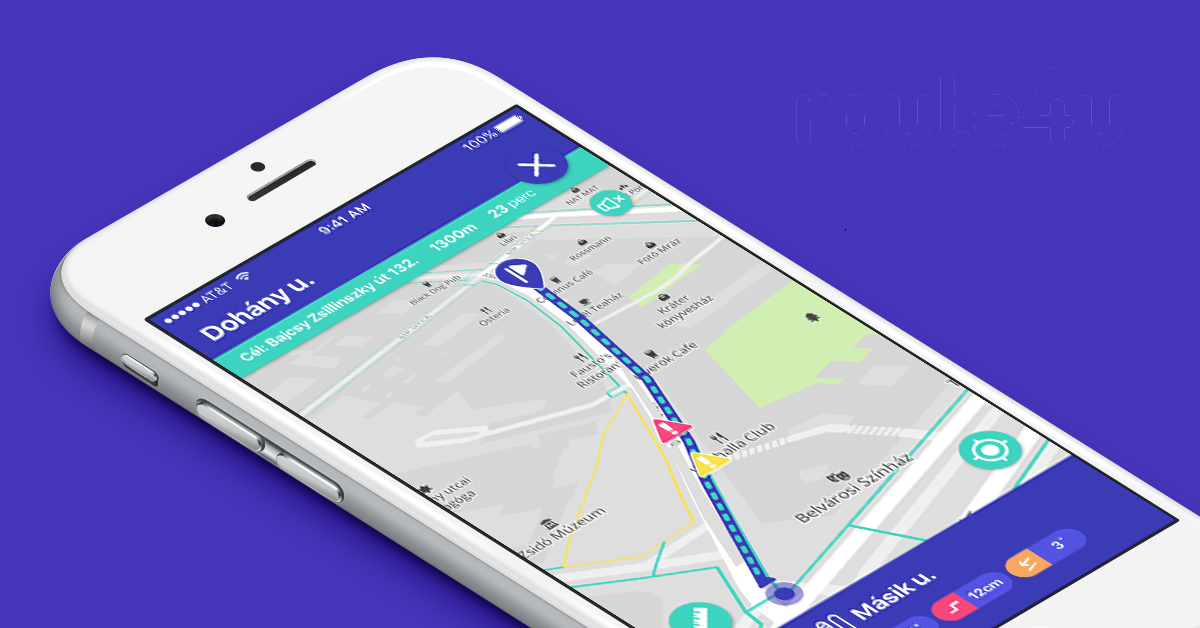
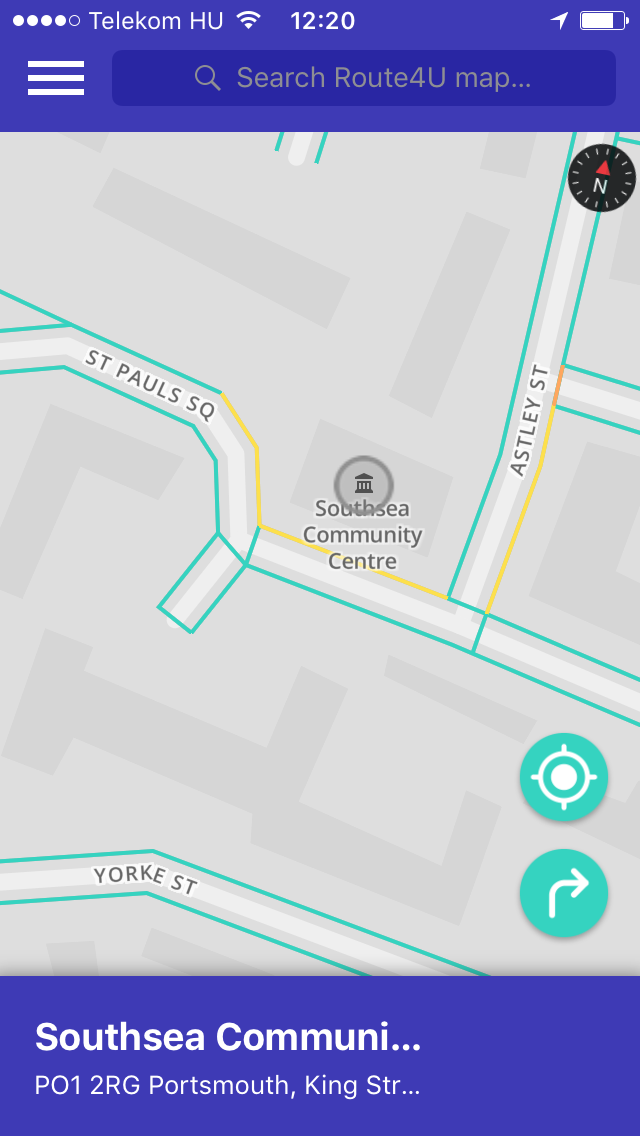
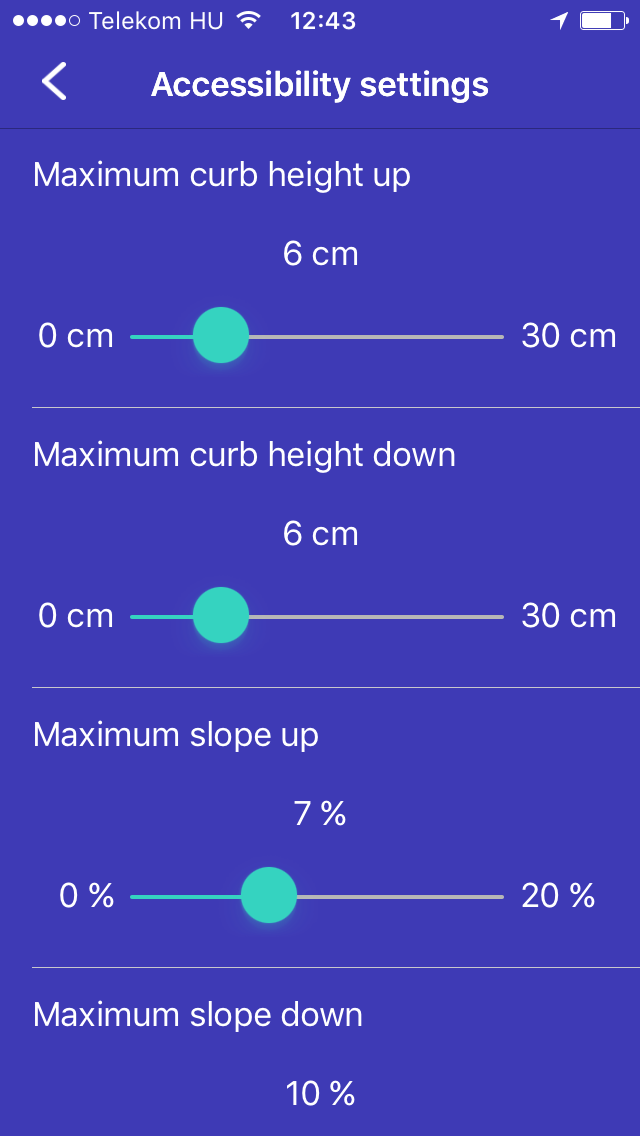
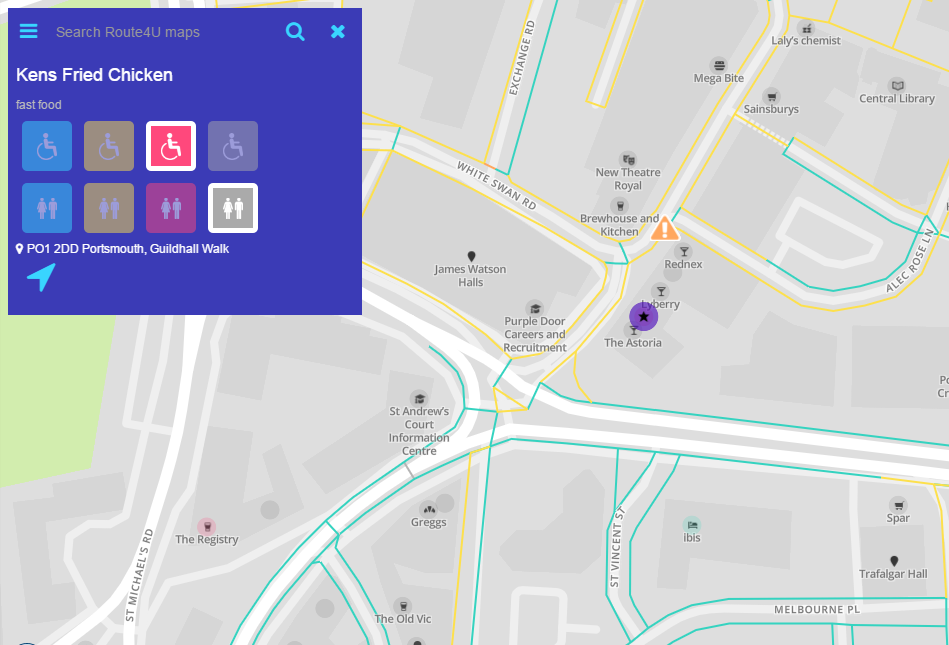
 The base of all this is city map with accessibility information. We create these, commissioned by local goverments by systemtically mapping sidewalks, curbs, slopes and services of a town or city. Thanks to our innovative technology, this is extremely fast and cost efficient, and also very cheap compared to city budgets. Personalized sidewalk navigation and search of the accessible services is available for the mapped areas shortly after our survey. We involve local organizations and the majority society in the survey. We raise awareness of the importance of equal opportunities with targeted, gamified communication campaigns. Thanks to our awareness-raising communication, it’s not uncommon that shops and other services of the city invest in accessibility plainly for business considerations. Don’t think about thousands of Euros here. Mounting a few Euros, bluetooth enabled disability bell on the outside of the shop not only helps a person in wheelchair, it also raises the prestige of the shop by making others content with the shop owners’ proactive behaviour. It also helps spreading the word and the idea.
 Thanks to the wheelchair users actively using Route4U, local governments can see the problematic points in the sidewalk infrastructure, making it possible to plan development or refurbishment priorities based on real-life data. Effective problem management increases voter satisfaction.